3. Optimize SQL steps
During the application development process, due to the small initial amount of data, developers paid more attention to functional implementation when writing SQL statements. However, when the application system was officially launched, with the rapid increase in the amount of production data, many SQL statements began to gradually appear. Performance problems will have an increasing impact on production. At this time, these problematic SQL statements will become the bottleneck of the entire system performance, so we must optimize them. This chapter will introduce in detail how to optimize SQL statements in MySQL. method.
When facing a database with SQL performance problems, where should we start to conduct systematic analysis so that we can locate the problematic SQL and solve the problem as soon as possible.
3.1 Check SQL execution frequency
After the MySQL client is successfully connected, server status information can be provided through the show [session|global] status command. show [session|global] status You can add the parameter “session” or “global” as needed to display session-level (current connection) statistics and global-level (since the last startup of the database) statistics. If not written, the default parameter used is “session”.
The following command displays the values of all statistical parameters in the current session:
show status like 'Com_______';

show status like 'Innodb_rows_%';

Com_xxx represents the number of times each xxx statement is executed. We usually care about the following statistical parameters.
| Parameter | Meaning |
|---|---|
| Com_select | The number of times the select operation is performed, only 1 is accumulated for one query. |
| Com_insert | The number of times the INSERT operation is performed. For batch insert INSERT operations, it is only accumulated once. |
| Com_update | The number of times UPDATE operations are performed. |
| Com_delete | The number of times the DELETE operation is performed. |
| Innodb_rows_read | Select The number of rows returned by the query. |
| Innodb_rows_inserted | The number of rows inserted by performing INSERT operation. |
| Innodb_rows_updated | The number of rows updated by UPDATE operation. |
| Innodb_rows_deleted | The number of rows deleted by DELETE operation. |
| Connections | The number of attempts to connect to the MySQL server. |
| Uptime | Server working time. |
| Slow_queries | The number of slow queries. |
Com_***: These parameters are accumulated for all storage engine table operations.
Innodb_***: These parameters are only for the InnoDB storage engine, and the accumulation algorithm is slightly different.
3.2 Locating inefficient execution of SQL
SQL statements that execute less efficiently can be located in the following two ways.
- Slow query log: Locate SQL statements with low execution efficiency through the slow query log. When started with the –log-slow-queries[=file_name] option, mysqld writes a log file containing all SQL statements that take more than long_query_time seconds to execute.
- show processlist: The slow query log is recorded after the query is completed. Therefore, when the application reflects execution efficiency problems, querying the slow query log cannot locate the problem. You can use the show processlist command to view the current MySQL threads in progress, including the status of the thread. Whether to lock the table, etc., you can check the execution status of SQL in real time and optimize some table lock operations.

1) id column, when a user logs in to mysql, the "connection_id" assigned by the system can be viewed using the function connection_id()

2) The user column displays the current user. If you are not root, this command will only display the sql statements within the user permission range.

3) The host column shows which IP and port the statement was sent from, which can be used to track the user who issued the problematic statement.

4) The db column shows which database this process is currently connected to.

5) The command column displays the executed command of the current connection. Generally, the values are sleep, query, connect, etc.

6) The time column displays the duration of this state in seconds.

7) The state column displays the status of the SQL statement using the current connection, which is a very important column. state describes a certain state in statement execution. A SQL statement, taking query as an example, may need to go through copying to tmp table, sorting result, sending data and other states before it can be completed.

8) The info column displays this sql statement, which is an important basis for judging the problem statement.
3.3 explain analysis execution plan
After querying the inefficient SQL statements through the above steps, you can use the EXPLAIN or DESC command to obtain information about how MySQL executes the SELECT statement, including how the tables are connected and the order of the connections during the execution of the SELECT statement.
Query the execution plan of a SQL statement:
explain select * from tb_item where id = 1;

explain select * from tb_item where title = 'Alcatel (OT-979) Glacier White China Unicom 3G Mobile Phone 3';

| Field | Meaning |
|---|---|
| id | The sequence number of the select query is a set of numbers that represents the order in which the select clause or table operation is executed in the query. |
| select_type | Indicates the type of SELECT. Common values are SIMPLE (simple table, that is, do not use Table connection or subquery), PRIMARY (main query, that is, the outer query), UNION (the second or subsequent query statement in UNION), SUBQUERY (the first SELECT in the subquery), etc. |
| table | Table of output result set |
| type | Indicates the connection type of the table. The connection types with good to poor performance are (system -> const —–> eq_ref ——> ref ——-> ref_or_null—-> index_merge -> index_subquery —–> range —–> index ——> all ) |
| possible_keys | Indicates the indexes that may be used during query |
| key | Represents the actual index used |
| key_len | The length of the index field |
| rows | The number of scanned rows |
| extra | Explanation and description of implementation |
3.3.1 Environment preparation

CREATE TABLE `t_role` (
  `id` varchar(32) NOT NULL,
  `role_name` varchar(255) DEFAULT NULL,
  `role_code` varchar(255) DEFAULT NULL,
  `description` varchar(255) DEFAULT NULL,
  PRIMARY KEY (`id`),
  UNIQUE KEY `unique_role_name` (`role_name`)
) ENGINE=InnoDB DEFAULT CHARSET=utf8;


CREATE TABLE `t_user` (
  `id` varchar(32) NOT NULL,
  `username` varchar(45) NOT NULL,
  `password` varchar(96) NOT NULL,
  `name` varchar(45) NOT NULL,
  PRIMARY KEY (`id`),
  UNIQUE KEY `unique_user_username` (`username`)
) ENGINE=InnoDB DEFAULT CHARSET=utf8;


CREATE TABLE `user_role` (
  `id` int(11) NOT NULL auto_increment,
  `user_id` varchar(32) DEFAULT NULL,
  `role_id` varchar(32) DEFAULT NULL,
  PRIMARY KEY (`id`),
  KEY `fk_ur_user_id` (`user_id`),
  KEY `fk_ur_role_id` (`role_id`),
  CONSTRAINT `fk_ur_role_id` FOREIGN KEY (`role_id`) REFERENCES `t_role` (`id`) ON DELETE NO ACTION ON UPDATE NO ACTION,
  CONSTRAINT `fk_ur_user_id` FOREIGN KEY (`user_id`) REFERENCES `t_user` (`id`) ON DELETE NO ACTION ON UPDATE NO ACTION
) ENGINE=InnoDB DEFAULT CHARSET=utf8;


insert into `t_user` (`id`, `username`, `password`, `name`) values('1','super','$2a$10$TJ4TmCdK.X4wv/tCqHW14.w70U3CC33CeVncD3SLmyMXMknstqKRe','super administrator ');
insert into `t_user` (`id`, `username`, `password`, `name`) values('2','admin','$2a$10$TJ4TmCdK.X4wv/tCqHW14.w70U3CC33CeVncD3SLmyMXMknstqKRe','system administrator ');
insert into `t_user` (`id`, `username`, `password`, `name`) values('3','itcast','$2a$10$8qmaHgUFUAmPR5pOuWhYWOr291WJYjHelUlYn07k5ELF8ZCrW0Cui','test02');
insert into `t_user` (`id`, `username`, `password`, `name`) values('4','stu1','$2a$10$pLtt2KDAFpwTWLjNsmTEi.oU1yOZyIn9XkziK/y/spH5rftCpUMZa','student 1' );
insert into `t_user` (`id`, `username`, `password`, `name`) values('5','stu2','$2a$10$nxPKkYSez7uz2YQYUnwhR.z57km3yqKn3Hr/p1FR6ZKgc18u.Tvqm','student 2' );
insert into `t_user` (`id`, `username`, `password`, `name`) values('6','t1','$2a$10$TJ4TmCdK.X4wv/tCqHW14.w70U3CC33CeVncD3SLmyMXMknstqKRe','Teacher 1' );


INSERT INTO `t_role` (`id`, `role_name`, `role_code`, `description`) VALUES('5','student','student','student');
INSERT INTO `t_role` (`id`, `role_name`, `role_code`, `description`) VALUES('7','teacher','teacher','teacher');
INSERT INTO `t_role` (`id`, `role_name`, `role_code`, `description`) VALUES('8','teaching manager','teachmanager','teaching manager');
INSERT INTO `t_role` (`id`, `role_name`, `role_code`, `description`) VALUES('9','admin','admin','admin');
INSERT INTO `t_role` (`id`, `role_name`, `role_code`, `description`) VALUES('10','super administrator','super','super administrator');


INSERT INTO user_role(id,user_id,role_id) VALUES(NULL, '1', '5'),(NULL, '1', '7'),(NULL, '2', '8'),(NULL, '3', '9'),(NULL, '4', '8'),(NULL, '5', '10') ;
3.3.2 explain’s id
The id field is the sequence number of the select query, which is a set of numbers that represents the order in which select clauses or table operations are executed in the query. There are three cases of id:
1) The same id means that the order of loading the table is from top to bottom.
explain select * from t_role r, t_user u, user_role ur where r.id = ur.role_id and u.id = ur.user_id;

2) The larger the id value is, the higher the priority will be and the earlier it will be executed.
EXPLAIN SELECT * FROM t_role WHERE id = (SELECT role_id FROM user_role WHERE user_id = (SELECT id FROM t_user WHERE username = 'stu1'))

3) IDs may be the same or different and exist at the same time. Those with the same ID can be considered as a group, and are executed sequentially from top to bottom; among all groups, the larger the value of the ID, the higher the priority and the earlier they are executed.
EXPLAIN SELECT * FROM t_role r , (SELECT * FROM user_role ur WHERE ur.`user_id` = '2') a WHERE r.id = a.role_id;

3.3.3 explain select_type
Indicates the type of SELECT. Common values are as shown in the following table:
| select_type | Meaning |
|---|---|
| SIMPLE | Simple select query, the query does not contain subqueries or UNION |
| PRIMARY | If the query contains any complex subqueries, the outermost query is marked with this identifier |
| SUBQUERY | Contains a subquery in the SELECT or WHERE list |
| DERIVED | Subqueries included in the FROM list are marked as DERIVED (derived). MYSQL will recursively execute these subqueries and place the results in a temporary table |
| UNION | If the second SELECT appears after UNION, it is marked as UNION; if UNION is included in the subquery of the FROM clause, the outer SELECT Will be marked as: DERIVED |
| UNION RESULT | SELECT to get the result from the UNION table |
3.3.4 explain table
Show which table this row of data relates to
3.3.5 type of explain
type displays the access type, which is a more important indicator. The possible values are:
| type | Meaning |
|---|---|
| NULL | MySQL does not access any tables or indexes and returns results directly |
| system | The table has only one row of records (equal to the system table). This is a special case of the const type and generally does not appear |
| const | means that it is found through the index once, const is used to compare primary key or unique index. Because only one row of data is matched, it is very fast. If you place the primary key in the where list, MySQL can convert the query into a constant. const Compares all parts of a “primary key” or “unique” index to a constant value |
| eq_ref | Similar to ref, the difference is that it uses a unique index and uses a related query of the primary key. There is only one record returned by the related query. Commonly used in primary key or unique index scans |
| ref | non-unique index scans, returning a match that matches a single value for all rows. It is essentially an index access, returning all rows (multiple) that match a single value |
| range | Retrieve only the given rows returned, using an index to select the rows. After where, operations such as between, <, >, in, etc. appear. |
| index | The difference between index and ALL is that the index type only traverses the index tree, which is usually faster than ALL , ALL is to traverse the data file. |
| all | The entire table will be traversed to find matching rows |
The resulting values from best to worst are:
NULL > system > const > eq_ref > ref > fulltext > ref_or_null > index_merge > unique_subquery > index_subquery > range > index > ALL


system > const > eq_ref > ref > range > index > ALL
Generally speaking, we need to ensure that the query reaches at least range level, preferably ref.
3.3.6 explain key
possible_keys: Displays one or more indexes that may be applied to this table.

key: The actual index used. If it is NULL, the index is not used.

key_len: Indicates the number of bytes used in the index. This value is the maximum possible length of the index field, not the actual length used. Without losing accuracy, the shorter the length, the better.
3.3.7 explain rows
The number of scan lines.
3.3.8 explain of extra
Other additional execution plan information is displayed in this column.
| extra | Meaning |
|---|---|
| using filesort | Indicates that mysql will use an external index to sort the data, rather than reading according to the index order in the table, which is called “file sorting” “, low efficiency. |
| using temporary | A temporary table is used to save intermediate results. MySQL uses temporary when sorting query results. surface. Common in order by and group by; low efficiency |
| using index | means that the corresponding select operation uses Covering the index avoids accessing the data rows of the table, which is very efficient. |
3.4 show profile analysis SQL
Mysql has added support for show profiles and show profile statements starting from version 5.0.37. show profiles can help us understand where time is spent when optimizing SQL.
Through the have_profiling parameter, you can see whether the current MySQL supports profile:

Profiling is turned off by default. Profiling can be turned on at the Session level through the set statement:

set profiling=1; //Turn on the profiling switch;
Through profile, we can understand the SQL execution process more clearly.
First, we can perform a series of operations, as shown in the figure below:
show databases;

use db01;

show tables;

select * from tb_item where id < 5;

select count(*) from tb_item;
After executing the above command, execute the show profiles command to view the time taken to execute the SQL statement:

Through the show profile for query query_id statement, you can view the status and time spent of each thread during the execution of the SQL:

TIP:
    The Sending data state indicates that the MySQL thread begins to access the data rows and returns the results to the client, rather than just returning the client. Since in the Sending data state, the MySQL thread often needs to do a lot of disk reading operations, it is often the longest time-consuming state in the entire query.
After obtaining the thread status that consumes the most time, MySQL supports further selecting detailed type classes such as all, cpu, block io, context switch, page faults, etc. to see what resources MySQL spent too much time on. For example, choose to view CPU time spent:

| Field | Meaning |
|---|---|
| Status | Sql statement execution status |
| Duration | The time consumption of each step in the sql execution process |
| CPU_user | Current cpu occupied by the user |
| CPU_system | cpu occupied by the system |
3.5 trace analysis optimizer execution plan
MySQL5.6 provides SQL tracking trace. Through the trace file, you can further understand why the optimizer chose plan A instead of plan B.
Open trace, set the format to JSON, and set the maximum memory size that trace can use to avoid complete display due to the default memory being too small during the parsing process. (Executed in the command line)
SET optimizer_trace="enabled=on",end_markers_in_json=on;
set optimizer_trace_max_mem_size=1000000;
Execute SQL statement:
select * from tb_item where id < 4;
Finally, check information_schema.optimizer_trace to see how MySQL executes SQL:
select * from information_schema.optimizer_trace;
**************************** 1. row ***************** **********
QUERY: select * from tb_item where id < 4
TRACE: {<!-- -->
  "steps": [
    {<!-- -->
      "join_preparation": {<!-- -->
        "select#": 1,
        "steps": [
          {<!-- -->
            "expanded_query": "/* select#1 */ select `tb_item`.`id` AS `id`,`tb_item`.`title` AS `title`,`tb_item`.`price` AS `price`,` tb_item`.`num` AS `num`,`tb_item`.`categoryid` AS `categoryid`,`tb_item`.`status` AS `status`,`tb_item`.`sellerid` AS `sellerid`,`tb_item` .`createtime` AS `createtime`,`tb_item`.`updatetime` AS `updatetime` from `tb_item` where (`tb_item`.`id` < 4)"
          }
        ] /* steps */
      } /* join_preparation */
    },
    {<!-- -->
      "join_optimization": {<!-- -->
        "select#": 1,
        "steps": [
          {<!-- -->
            "condition_processing": {<!-- -->
              "condition": "WHERE",
              "original_condition": "(`tb_item`.`id` < 4)",
              "steps": [
                {<!-- -->
                  "transformation": "equality_propagation",
                  "resulting_condition": "(`tb_item`.`id` < 4)"
                },
                {<!-- -->
                  "transformation": "constant_propagation",
                  "resulting_condition": "(`tb_item`.`id` < 4)"
                },
                {<!-- -->
                  "transformation": "trivial_condition_removal",
                  "resulting_condition": "(`tb_item`.`id` < 4)"
                }
              ] /* steps */
            } /* condition_processing */
          },
          {<!-- -->
            "table_dependencies": [
              {<!-- -->
                "table": "`tb_item`",
                "row_may_be_null": false,
                "map_bit": 0,
                "depends_on_map_bits": [
                ] /* depends_on_map_bits */
              }
            ] /* table_dependencies */
          },
          {<!-- -->
            "ref_optimizer_key_uses": [
            ] /* ref_optimizer_key_uses */
          },
          {<!-- -->
            "rows_estimation": [
              {<!-- -->
                "table": "`tb_item`",
                "range_analysis": {<!-- -->
                  "table_scan": {<!-- -->
                    "rows": 9816098,
                    "cost": 2.04e6
                  } /* table_scan */,
                  "potential_range_indices": [
                    {<!-- -->
                      "index": "PRIMARY",
                      "usable": true,
                      "key_parts": [
                        "id"
                      ] /* key_parts */
                    }
                  ] /* potential_range_indices */,
                  "setup_range_conditions": [
                  ] /* setup_range_conditions */,
                  "group_index_range": {<!-- -->
                    "chosen": false,
                    "cause": "not_group_by_or_distinct"
                  } /* group_index_range */,
                  "analyzing_range_alternatives": {<!-- -->
                    "range_scan_alternatives": [
                      {<!-- -->
                        "index": "PRIMARY",
                        "ranges": [
                          "id < 4"
                        ] /* ranges */,
                        "index_dives_for_eq_ranges": true,
                        "rowid_ordered": true,
                        "using_mrr": false,
                        "index_only": false,
                        "rows": 3,
                        "cost": 1.6154,
                        "chosen": true
                      }
                    ] /* range_scan_alternatives */,
                    "analyzing_roworder_intersect": {<!-- -->
                      "usable": false,
                      "cause": "too_few_roworder_scans"
                    } /* analyzing_roworder_intersect */
                  } /* analyzing_range_alternatives */,
                  "chosen_range_access_summary": {<!-- -->
                    "range_access_plan": {<!-- -->
                      "type": "range_scan",
                      "index": "PRIMARY",
                      "rows": 3,
                      "ranges": [
                        "id < 4"
                      ] /* ranges */
                    } /* range_access_plan */,
                    "rows_for_plan": 3,
                    "cost_for_plan": 1.6154,
                    "chosen": true
                  } /* chosen_range_access_summary */
                } /* range_analysis */
              }
            ] /* rows_estimation */
          },
          {<!-- -->
            "considered_execution_plans": [
              {<!-- -->
                "plan_prefix": [
                ] /* plan_prefix */,
                "table": "`tb_item`",
                "best_access_path": {<!-- -->
                  "considered_access_paths": [
                    {<!-- -->
                      "access_type": "range",
                      "rows": 3,
                      "cost": 2.2154,
                      "chosen": true
                    }
                  ] /* considered_access_paths */
                } /* best_access_path */,
                "cost_for_plan": 2.2154,
                "rows_for_plan": 3,
                "chosen": true
              }
            ] /* considered_execution_plans */
          },
          {<!-- -->
            "attaching_conditions_to_tables": {<!-- -->
              "original_condition": "(`tb_item`.`id` < 4)",
              "attached_conditions_computation": [
              ] /* attached_conditions_computation */,
              "attached_conditions_summary": [
                {<!-- -->
                  "table": "`tb_item`",
                  "attached": "(`tb_item`.`id` < 4)"
                }
              ] /* attached_conditions_summary */
            } /* attaching_conditions_to_tables */
          },
          {<!-- -->
            "refine_plan": [
              {<!-- -->
                "table": "`tb_item`",
                "access_type": "range"
              }
            ] /* refine_plan */
          }
        ] /* steps */
      } /* join_optimization */
    },
    {<!-- -->
      "join_execution": {<!-- -->
        "select#": 1,
        "steps": [
        ] /* steps */
      } /* join_execution */
    }
  ] /* steps */
}
 ] /* attached_conditions_summary */
        } /* attaching_conditions_to_tables */
      },
      {
        "refine_plan": [
          {
            "table": "`tb_item`",
            "access_type": "range"
          }
        ] /* refine_plan */
      }
    ] /* steps */
  } /* join_optimization */
},
{
  "join_execution": {
    "select#": 1,
    "steps": [
    ] /* steps */
  } /* join_execution */
}
] /* steps */
}
## Network Security Engineer (White Hat) Enterprise Level Learning Route ### Phase 1: Security Basics (Getting Started) 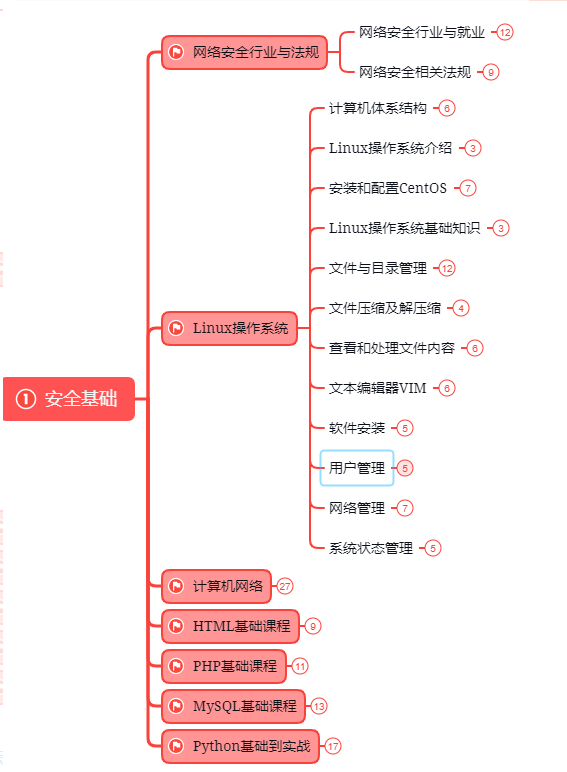 ### Phase 2: Web Penetration (Junior Network Security Engineer) 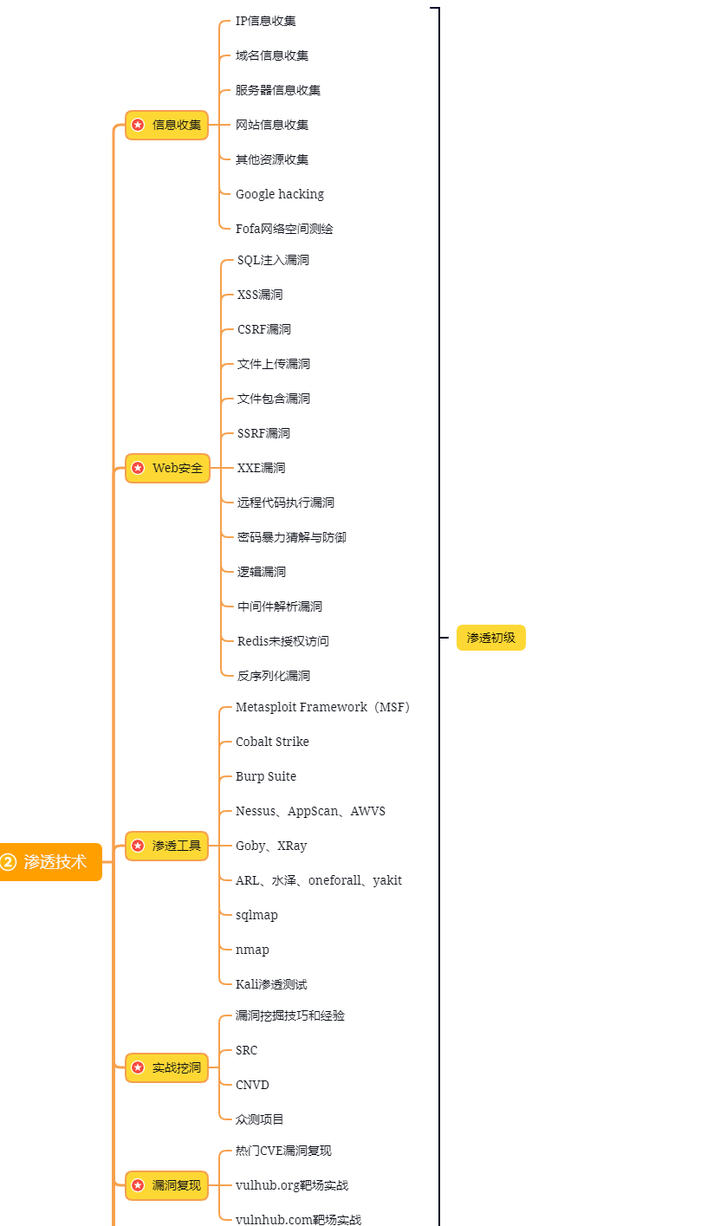 ### The third stage: Advanced part (intermediate network security engineer) 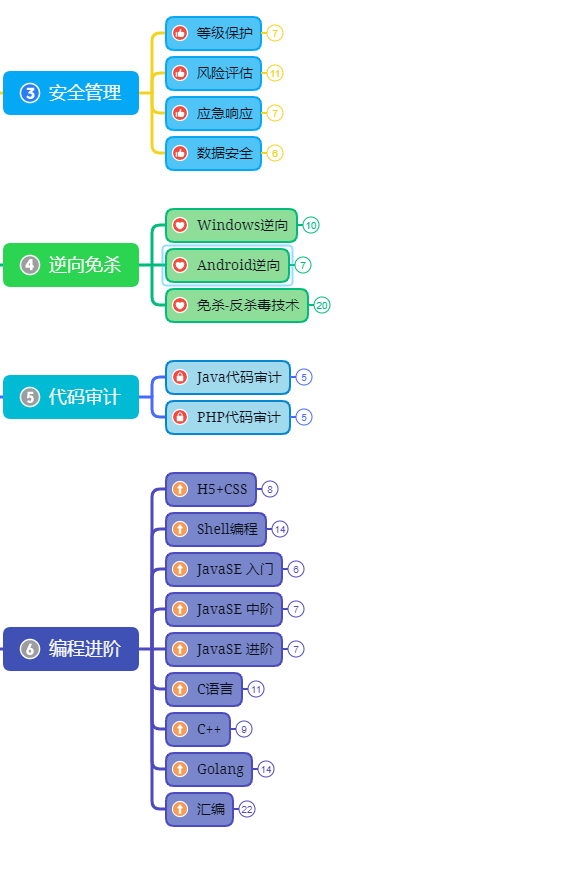 If you are interested in getting started with network security, you can click here if you need it **** [Breaking benefits of network security: Getting started & advanced full set of 282G learning resource package to share for free! ](https://mp.weixin.qq.com/s/BWb9OzaB-gVGVpkm161PMw) ## Learning resource sharing  <img src="//i2.wp.com/hnxx.oss-cn-shanghai.aliyuncs.com/official/1678694737820.png?t=0.6334725112165747" />