Table of Contents
1. Basic principles of DB3 wavelet transform
2. Mathematical formula of DB3 wavelet transform
3. Principle of peak detection
4. Peak detection steps based on DB3 wavelet transform
5. Matlab core program
6. Simulation result test
DB3 wavelet transform is a commonly used signal processing method. It has the characteristics of multi-scale analysis, time-frequency localization, etc., and is suitable for processing non-stationary signals. Peak detection is an application direction of DB3 wavelet transform. Its principle and mathematical formula are as follows:
1. Basic principles of DB3 wavelet transform
Wavelet transform is a signal analysis method that can decompose the signal into multiple sub-bands and perform local analysis on each sub-band. DB3 wavelet transform is a discrete wavelet transform. Its basic principle is to decompose the signal into multiple wavelet coefficients on a series of scales. Each wavelet coefficient represents the contribution of the signal in a certain frequency range. By analyzing these wavelet coefficients, multi-scale analysis, time-frequency localization and other operations can be performed on the signal.
2. Mathematical formula of DB3 wavelet transform
The mathematical formula of DB3 wavelet transform is as follows:
Yn = ∑k=0N-1h(k)×[Xn-k] + ∑k=0N-1g(k)×[Xn-2k]
Among them, Xn represents the value of the input signal at the n-th sampling point, Yn represents the value of the output signal at the n-th sampling point, h(k) and g(k) are the filter coefficients of DB3 wavelet transform. By adjusting the filter coefficients, different wavelet coefficients can be obtained, thereby achieving multi-scale analysis of the signal.
3. Principle of Peak Detection
Peak detection is a commonly used signal processing method that extracts mutation points or peaks in a signal. The principle of peak detection is to determine whether it is a peak point based on the sign and size of the wavelet coefficients. Specifically, if a wavelet coefficient is larger than its adjacent wavelet coefficient and its sign is positive, then this point may be a peak point. By setting a certain threshold, these peak points can be extracted.
4. Peak detection steps based on DB3 wavelet transform
Peak detection based on DB3 wavelet transform can be divided into the following steps:
- Perform DB3 wavelet transform on the input signal to obtain a series of wavelet coefficients.
- Based on the sign and size of the wavelet coefficients, wavelet coefficients that may be peak points are initially screened out.
- According to certain rules (such as threshold method or statistical method), the real peak points are further screened out.
- As needed, post-process the peak points, such as position correction, peak extraction, etc.
Peak detection based on DB3 wavelet transform can be applied to many fields, such as signal processing, image processing, speech recognition, etc. For example, in electrocardiogram signal processing, peak detection can be used to extract features such as P waves and QRS waves in the electrocardiogram signal; in image processing, peak detection can be used to extract edge information in the image; in speech recognition, Extract formant information in speech signals through peak detection.
5. Matlab core program
clc;
clear;
close all;
warning off;
load Data190329111438.mat
figure;
subplot(311);
plot(Times,AngleXdeg);
hold on
plot(Times,AngleYdeg,'r');
hold on
plot(Times,AngleZdeg,'k');
xlabel('time');ylabel('Angle');
legend('x','y','z');
subplot(312);
plot(Times,axg);
hold on
plot(Times,ayg,'r');
hold on;
plot(Times,azg,'k');
xlabel('time');ylabel('a');
legend('x','y','z');
subplot(313);
plot(Times,wxdegs);
hold on
plot(Times,wydegs,'r');
hold on
plot(Times,wzdegs,'k');
xlabel('time');ylabel('w');
legend('x','y','z');
ax1 = func_wavlet(axg);
ay1 = func_wavlet(ayg);
az1 = func_wavlet(azg);
Timesa=Times(1:length(ax1));
load Data190329111511.mat
figure;
subplot(311);
plot(Times1,AngleXdeg1);
hold on
plot(Times1,AngleYdeg1,'r');
hold on
plot(Times1,AngleZdeg1,'k');
xlabel('time');ylabel('Angle');
legend('x','y','z');
subplot(312);
plot(Times1,axg1);
hold on
plot(Times1,ayg1,'r');
hold on;
plot(Times1,azg1,'k');
xlabel('time');ylabel('a');
legend('x','y','z');
subplot(313);
plot(Times1,wxdegs1);
hold on
plot(Times1,wydegs1,'r');
hold on
plot(Times1,wzdegs1,'k');
xlabel('time');ylabel('w');
legend('x','y','z');
ax2 = func_wavlet(axg1);
ay2 = func_wavlet(ayg1);
az2 = func_wavlet(azg1);
Times2=Times1(1:length(ax2));
load Data190329111540.mat
figure;
subplot(311);
plot(Times,AngleXdeg);
hold on
plot(Times,AngleYdeg,'r');
hold on
plot(Times,AngleZdeg,'k');
xlabel('time');ylabel('Angle');
legend('x','y','z');
subplot(312);
plot(Times,axg);
hold on
plot(Times,ayg,'r');
hold on;
plot(Times,azg,'k');
xlabel('time');ylabel('a');
legend('x','y','z');
subplot(313);
plot(Times,wxdegs);
hold on
plot(Times,wydegs,'r');
hold on
plot(Times,wzdegs,'k');
xlabel('time');ylabel('w');
legend('x','y','z');
ax3 = func_wavlet(axg);
ay3 = func_wavlet(ayg);
az3 = func_wavlet(azg);
Times3=Times(1:length(ax3));
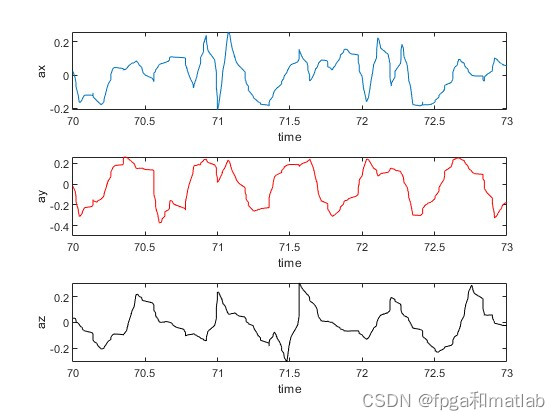
figure;
subplot(311);
plot(Timesa,ax1);xlim([70,73]);
xlabel('time');
ylabel('ax');
subplot(312);
plot(Timesa,ay1,'r');xlim([70,73]);
xlabel('time');
ylabel('ay');
subplot(313);
plot(Timesa,az1,'k');xlim([70,73]);
xlabel('time');
ylabel('az');
figure;
subplot(311);
plot(Times2,ax2);xlim([102,105]);
xlabel('time');
ylabel('ax');
subplot(312);
plot(Times2,ay2,'r');xlim([102,105]);
xlabel('time');
ylabel('ay');
subplot(313);
plot(Times2,az2,'k');xlim([102,105]);
xlabel('time');
ylabel('az');
figure;
subplot(311);
plot(Times3,ax3);xlim([130,133]);
xlabel('time');
ylabel('ax');
subplot(312);
plot(Times3,ay3,'r');xlim([130,133]);
xlabel('time');
ylabel('ay');
subplot(313);
plot(Times3,az3,'k');xlim([130,133]);
xlabel('time');
ylabel('az');
save R1.mat ax1 ay1 az1 ax2 ay2 az2 ax3 ay3 az3 Timesa Times2 Times3
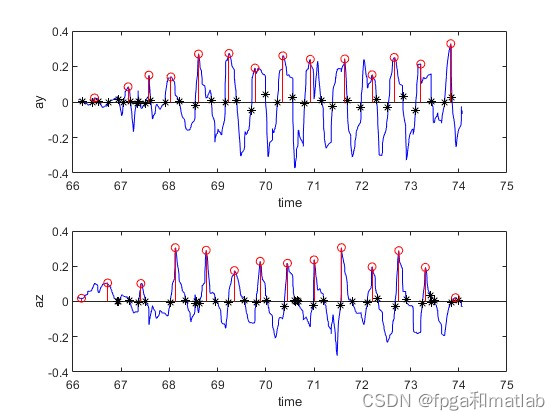
[locsy1,indxy1]=func_peak(ay1);
[locsz1,indxz1]=func_peak(az1);
[locsy2,indxy2]=func_peak(ay2);
[locsz2,indxz2]=func_peak(az2);
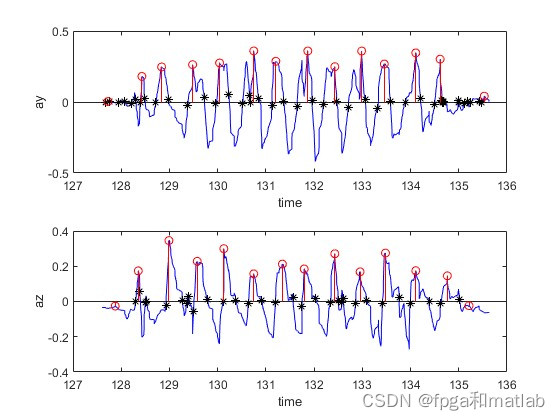
[locsy3,indxy3]=func_peak(ay3);
[locsz3,indxz3]=func_peak(az3);
figure;
subplot(211);
plot(Timesa,ay1,'b');
hold on
plot(Timesa(locsy1),ay1(locsy1),'ro');
hold on
plot(Timesa(indxy1),ay1(indxy1),'k*');
hold on
stem(Timesa(locsy1),ay1(locsy1),'ro')
xlabel('time');
ylabel('ay');
subplot(212);
plot(Timesa,az1,'b');;
hold on
plot(Timesa(locsz1),az1(locsz1),'ro');
hold on
plot(Timesa(indxz1),az1(indxz1),'k*');
hold on
stem(Timesa(locsz1),az1(locsz1),'ro')
xlabel('time');
ylabel('az');
figure;
subplot(211);
plot(Times2,ay2,'b');
hold on
plot(Times2(locsy2),ay2(locsy2),'ro');
hold on
plot(Times2(indxy2),ay2(indxy2),'k*');
hold on
stem(Times2(locsy2),ay2(locsy2),'ro')
xlabel('time');
ylabel('ay');
subplot(212);
plot(Times2,az2,'b');;
hold on
plot(Times2(locsz2),az2(locsz2),'ro');
hold on
plot(Times2(indxz2),az2(indxz2),'k*');
hold on
stem(Times2(locsz2),az2(locsz2),'ro')
xlabel('time');
ylabel('az');
figure;
subplot(211);
plot(Times3,ay3,'b');
hold on
plot(Times3(locsy3),ay3(locsy3),'ro');
hold on
plot(Times3(indxy3),ay3(indxy3),'k*');
hold on
stem(Times3(locsy3),ay3(locsy3),'ro')
xlabel('time');
ylabel('ay');
subplot(212);
plot(Times3,az3,'b');;
hold on
plot(Times3(locsz3),az3(locsz3),'ro');
hold on
plot(Times3(indxz3),az3(indxz3),'k*');
hold on
stem(Times3(locsz3),az3(locsz3),'ro')
xlabel('time');
ylabel('az');
up3054
6. Simulation result test
Peak detection based on DB3 wavelet transform is an effective signal processing method. It can realize multi-scale analysis of signals, time-frequency localization and other operations, and can extract mutation points or peaks in signals. In practical applications, it is necessary to select appropriate wavelet bases and decomposition scales according to specific problems, and adjust thresholds or filtering rules to obtain better peak detection results.