1. Debug page js code
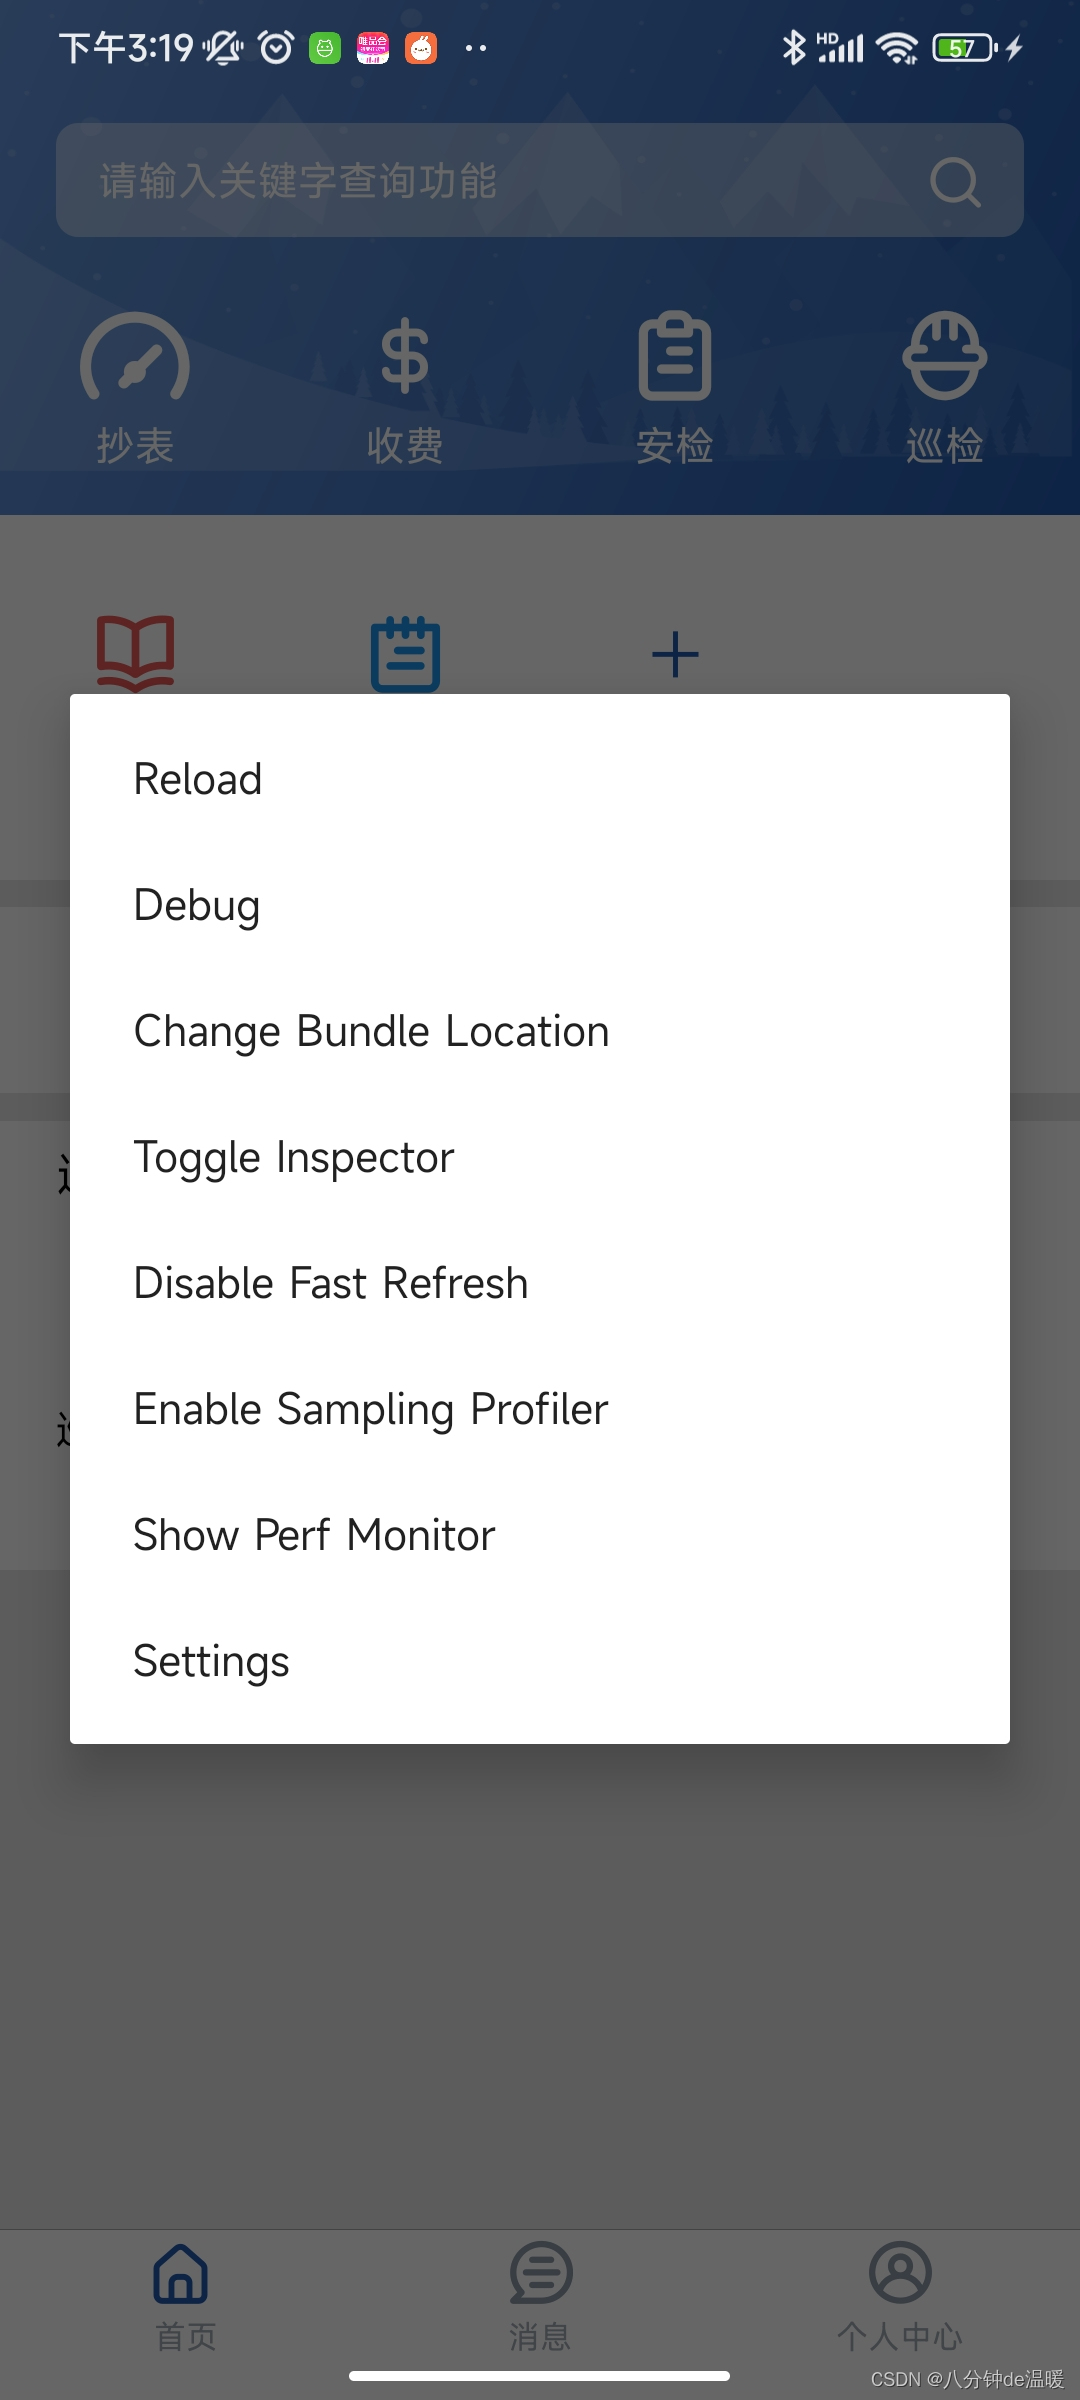
I used a real device for debugging. When the phone shakes, a page will appear. Click debug.
After clicking debug, the page will appear. Click the prompt operation shortcut key to display the developer tools.

Note: You cannot directly see the App user interface in Chrome, but can only provide console output and debug js scripts at the sources item break point. Some old tutorials and articles will mention the React Chrome plug-in, which currently does not support React Native and is not required for debugging itself. However, you can install the independent (non-plugin) version of React Developer Tools to assist in viewing the interface layout. The specific installation method will be described below.
Note: Currently, network requests in React Native cannot be observed using Chrome debugging. You can use the more powerful third-party react-native-debugger or the official flipper (note that it is only available in versions 0.62 and above).

If there is debug in the page, it will enter debug mode, which will facilitate our debugging.
2. Debugging nested H5 pages
Execute chrome://inspect/#devices in the browser
Then click on the mobile phone to enter the nested H5 web page, click inspect, and the following debugging page will pop up.


Method 1: Every time I modify the code, I need to recompile it, which makes debugging very inconvenient.
Method 2: I started a file running html locally. The domain name is the IP address, not localhost and 127.0.0.1.
After modifying the code in this way, there is no need to recompile each time. H5 is also convenient for debugging on Google Chrome. However, when packaging, you must switch to method 1 before packaging it into an apk.
Method 3: I tested Method 3, but only the page code of the H5 page was displayed and was not rendered. The problem is unknown.
Method 1: //const WEB_VIEW_URL = { uri: 'file:///android_asset/page/baidu-map/polling-task/polling-task.html' };
Method 2: const WEB_VIEW_URL = {<!-- --> uri: 'http://172.16.100.59:5500/android/app/src/main/assets/page/baidu-map/polling-task/polling- task.html'};

Method 3: //const WEB_VIEW_URL = require('../assets/page/baidu-map/polling-task/polling-task.html');
//const WEB_VIEW_URL = { uri: 'http://192.168.2.144:8000/android/app/src/main/assets/page/baidu-map/polling-task/polling-task.html' };

export default WEB_VIEW_URL;
3. Use react-devtools tool
1. Install react-devtools, because I am running a macos system. During the global installation of npm install -g react-devtools@^3, I always prompt that the dependency cannot be found https://github.com/electron/electron/releases /download/v1.8.8/electron-v1.8.8-darwin-arm64.zip actually cannot find 404, but I saw https://github.com/electron/electron/releases/download/v1.8.8/electron- v1.8.8-darwin-x64.zip
M1 Mac electron reports error Failed to find Electron v xxx for darwin-arm64
If you encounter the "Failed to find Electron v xxx for darwin-arm64" error when using Electron on an M1 Mac, it means that the currently installed version of Electron does not support the arm64 architecture of the M1 Mac.

Make sure you have the arm64 version of Node.js installed on your computer. You can check the current Node.js architecture by running the node -p process.arch command. If the output is arm64, you are already running Node.js on arm64 architecture.

The node version was inconsistent, and the architecture of node.js was also inconsistent. Then I switched to version 11.13.0 and successfully installed react-devtools.
The nvm use command only takes effect in the current terminal session. nvm use 11.13.0 nvm alias
The command only needs to be run once, and it will automatically apply the global version of the settings every time you open a new terminal window. nvm alias default 11.13.0
Then run react-devtools in the terminal, and the page as shown below will appear. PS cannot start react native debugger, otherwise it will not be displayed.

Execute in the terminal: I don’t know if this sentence is useful
adb reverse tcp:8097 tcp:8097
adb reverse tcp:8097 The role of tcp:8097
adb reverse tcp:8097 tcp:8097 is a command used for Android debugging. Its function is to map the port on the device to the port on the local computer.
Specifically, this command maps TCP port 8097 on the device to TCP port 8097 on the local computer. The purpose of this is to enable services on your local machine, such as the React Native Debugger or other debugging tools, to communicate with the application running on the device.
When you run the adb reverse tcp:8097 tcp:8097 command, applications on the device can access services running on the local computer through localhost:8097 or 127.0.0.1:8097.
Execute Toggle Inspector


4. Use the react native debugger tool
https://github.com/jhen0409/react-native-debugger
The page after running is

The console and network can be viewed normally, but the devtools are not displayed normally. At first, I thought the devtools version was the react-devtools version. In fact, it is not. It is the react native debugger that has a built-in devTools version during installation. devtools is not displayed. , it is possible that the version is wrong. Then, let’s do this for now. .
If the React Native Debugger stays in the "Loading React Element Tree..." state and nothing happens when loading the React element tree, there may be several reasons for this. Here are some possible solutions:

Check React Native Debugger version: Make sure the React Native Debugger version you are using is compatible with your React Native application. Try upgrading to the latest version of the React Native Debugger to make sure it's up to date with your project.

Check React Native version: Make sure your React Native version is compatible with the React Native Debugger. Some versions of React Native may not be compatible with certain versions of the React Native Debugger. Try upgrading or downgrading your React Native version to be compatible with the React Native Debugger.

Check network connection: Make sure your device is connected to the internet and doesn't have any network issues. React Native Debugger needs to load the React element tree from a remote server. If there is a problem with your network connection, loading may fail or be delayed.

Check debugging configuration: Make sure you have configured the React Native Debugger debugging options correctly. In the metro.config.js file in your project, ensure that the debugging option is enabled and that parameters such as host and port are configured correctly.

Check application status: If your React Native application is in a crashed or error state, it may prevent the React Native Debugger from loading the React element tree. Make sure your application runs without any errors or exceptions.

Clear Cache: Try clearing React Native Debugger’s cache. You can try deleting the ~/.rndebugger directory (for macOS and Linux) or the %USERPROFILE%/.rndebugger directory (for Windows) and restart React Native Debugger.

Try other debugging tools: If none of the above methods solve the problem, you can try using other React Native debugging tools, such as Reactotron or Flipper, to debug your React Native app.
To open http://localhost:8081/debugger-ui in a browser for debugging, you need to start the Metro server first.
Metro Server is a development server that packages your JavaScript code and serves it to your application. It also provides a debugging interface that you can open in your browser to debug your React Native application.
After starting the Metro server, you can open http://localhost:8081/debugger-ui in your browser to access the debug interface. In the debugging interface, you can view the application’s logs, perform remote debugging, check network requests, etc.
Please note that in order to be able to access the debugging interface in the browser, your device or emulator needs to be on the same network environment as the computer running the Metro server so that localhost can be reached.
If you can’t open the debugging interface in your browser, make sure the Metro server has started successfully and check for issues such as network connectivity and firewall settings.
A colleague’s window system reported an error when starting the metro service.
error Invalid regular expression: /(.\fixtures\.|node_modules[\]react[\]dist[\].*|webs
The solution is to find this file
\\
ode_modules\metro-config\src\defaults\blacklist.js
Replace content
var sharedBlacklist = [
/node_modules[/\]react[/\]dist[/\]./,
/website/node_modules/./,
/heapCapture/bundle.js/,
/./tests/./
];
When installing an application, it prompts “Installation failed, an application with a signature conflict has been installed.” It may be that it has not been uninstalled
Connect the mobile phone to the computer via USB, and use the adb command to check whether the package name has been completely uninstalled.
adb shell pm list packages -3
Then use the command to uninstall the package name
adb uninstall com.dataofx.XXXX
react-native uses webview to nest Baidu Map H5 web page, and found that the click event of the map is not sensitive
After testing, when nesting a general H5 web page, the click event of click is normal, but when nesting an H5 web page of Baidu Map, the click event is not sensitive.
I put
<script
      type="text/javascript"
      src="http://api.map.baidu.com/api?v=3.0 & amp;ak="

    >
    </script>
Replace with
 <script type="text/javascript"
      src="//i2.wp.com/api.map.baidu.com/api?v=1.0 & amp;type=webgl & amp;ak=xxx"></script>
The click event will be normal, and then replace all new BMap in the page with new BMapGL. The coordinates in the click event are e.latlng
You cannot get e.point. Use e.latlng for map click events and e.latLng for marker click events. The fields obtained are different. This is really a pitfall! ! ! ! ! ! ! ! !