The main steps
1. Generate analog bpsk signal based on digital signal
2. Input the data into the matched filter for demodulation
clc
clear all
N=200; % sequence length
L=512; Points of ?T
f1=100;fsam=10000; % carrier frequency f1, and sampling frequency fsam
T=1/fsam; % sampling interval
wsam=2*pi*fsam; %Sampling angular frequency
t1=(0:N-1)*T; % time domain abscissa
x1=50*sin(2*pi*f1*t1); % sampling
x2=fft(x1,L); % Perform FFT operation of point L
x3=fftshift(x2); %Exchange left and right with fsam/2 as the axis
x4=abs(x3); % take the modulus value
f=(-wsam/2 + (0:L-1)*wsam/L)/(2*pi); % frequency domain abscissa
%The following uses digital signals to generate BPSK signals ------------------------------------------ -------------------------------------------------- ----------------
psk_wave=[];
carry_wave_1=x1; % Carrier when the digital signal is 1
carry_wave_2=-x1; % The carrier wave when the digital signal is 0
digital_signal=[0 1 0 0 1 1 0 0 1 0]; % digital signal
%Generate BPSK signal
for i=1:length(digital_signal)
if digital_signal(i)==1
psk_wave=[psk_wave,carry_wave_1];
else
psk_wave=[psk_wave,carry_wave_2];
end
end
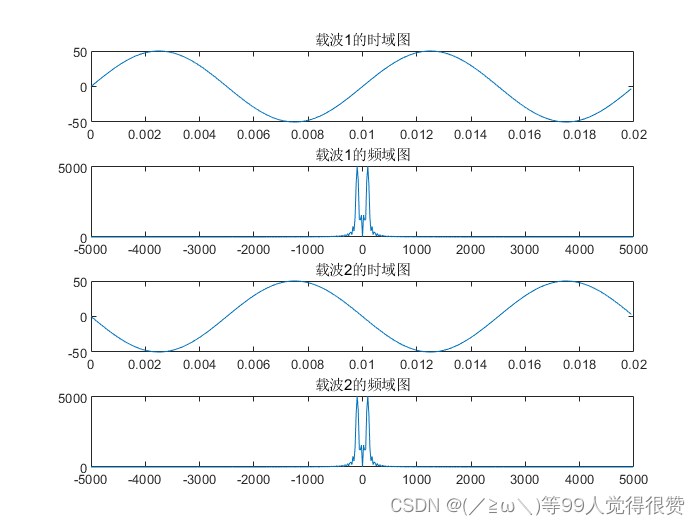
%Look at the time domain diagram and spectrum of the carrier signal
figure(1);
subplot(4,1,1);plot(t1,carry_wave_1);title('Time domain diagram of carrier 1'); % draw the time domain image of carrier 1
subplot(4,1,2);plot(f,abs(fftshift(fft(carry_wave_1,L))));title('Frequency domain map of carrier 1'); % draw carrier 1 frequency domain image, amplitude Multiply by 2 and divide by N to get the true magnitude
subplot(4,1,3);plot(t1,carry_wave_2);title('Time domain diagram of carrier 2'); % draw the time domain image of carrier 2
subplot(4,1,4);plot(f,abs(fftshift(fft(carry_wave_2,L))));title('Frequency domain diagram of carrier 2'); % draw carrier 2 frequency domain image
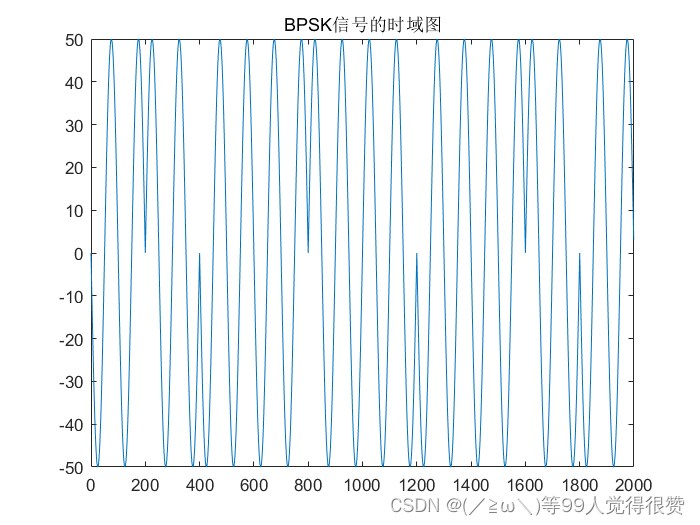
%Look at the time domain diagram of the BPSK signal lasting 10 symbols
figure(2);
t2=0:(length(digital_signal)*N-1);
plot(t2,psk_wave);title('Time domain diagram of BPSK signal'); %psk_wave is a signal with 10 symbols connected, the length is 2000
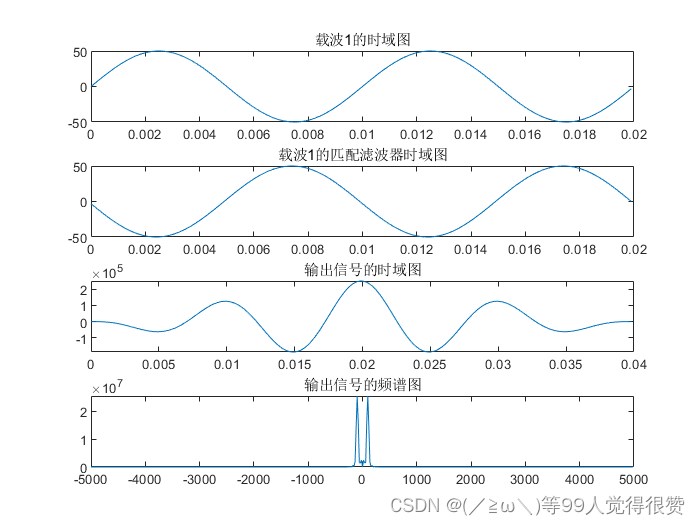
% Take an example to see the case where the carrier 1 signal passes through the dedicated matched filter for the carrier 1 signal. -------------------------------------------------- -----------------------------
ht1=fliplr(carry_wave_1); % The impulse response of the matched filter, the original signal can be mirrored and flipped
st1=conv(carry_wave_1,ht1); %The impulse response is convolved with the input signal, and the maximum value appears at the end of the time domain in theory
t4=(0:(2*N-2))*T;
st1_fft=abs(fftshift(fft(st1,L))); %Look at the spectrum of the output signal after convolution
figure(3);
subplot(4,1,1);plot(t1,carry_wave_1);title('Time domain diagram of carrier 1'); %Time domain diagram of input signal
subplot(4,1,2);plot(t1,ht1);title('matched filter time domain diagram of carrier 1') %matched filter time domain diagram
subplot(4,1,3);plot(t4,st1);title('Time domain diagram of output signal') %Time domain diagram of output signal
subplot(4,1,4);plot(f,st1_fft);title('spectrogram of output signal') % spectrum of output signal
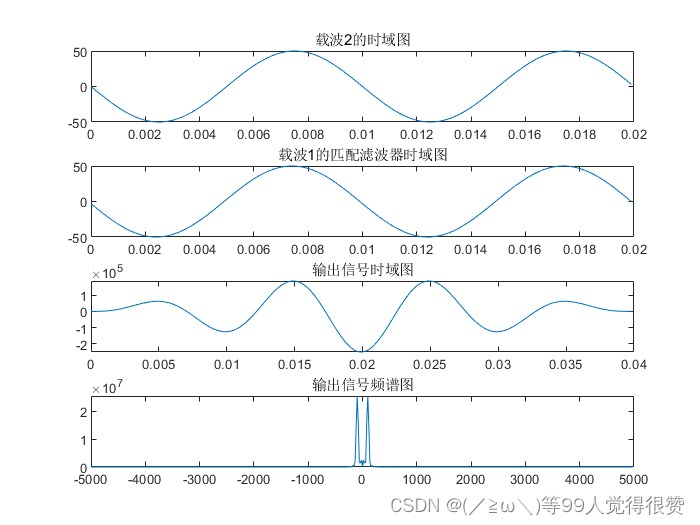
% Take an example to see what happens when the carrier 2 signal passes through the dedicated matched filter for the carrier 1 signal. -------------------------------------------------- -----------------------------
ht2=fliplr(carry_wave_1); % The impulse response of the matched filter, the original signal can be mirrored and flipped
st2=conv(carry_wave_2,ht2); %The impulse response is convoluted with the input signal, and the maximum value appears at the end of the time domain in theory
t5=(0:(2*N-2))*T;
st2_fft=abs(fftshift(fft(st2,L))); %Look at the spectrum of the output signal after convolution
figure(4);
subplot(4,1,1);plot(t1,carry_wave_2);title('Time domain diagram of carrier 2') % time domain diagram of input signal
subplot(4,1,2);plot(t1,ht2);title('Matched Filter Time Domain Diagram of Carrier 1') % Time Domain Diagram of Matched Filter
subplot(4,1,3);plot(t5,st2);title('output signal time domain diagram') % time domain diagram of output signal
subplot(4,1,4);plot(f,st2_fft);title('output signal spectrogram') % spectrum of output signal
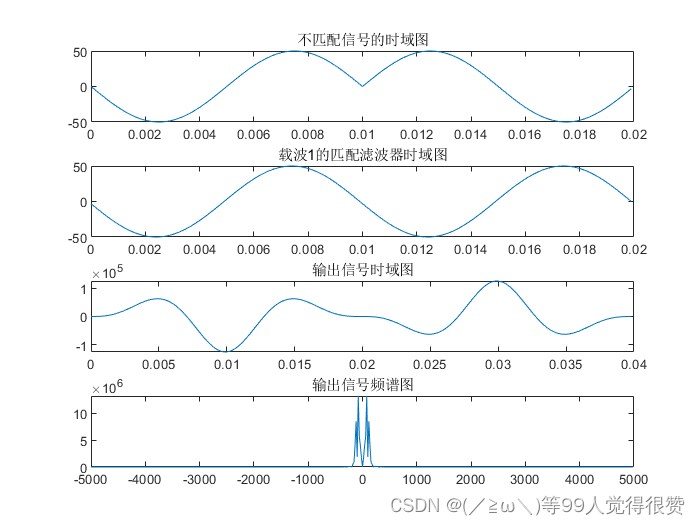
% Give an example to see the case where a completely mismatched signal passes through a dedicated matched filter for carrier 1 signal. -------------------------------------------------- ----------------------
wave_no_fit=[];
for i=1:N
wave_no_fit(i)=psk_wave(i + N/2);
end
ht3=fliplr(carry_wave_1); % The impulse response of the matched filter, the original signal can be mirrored and flipped
st3=conv(wave_no_fit,ht3); %The impulse response is convoluted with the input signal, and the maximum value appears at the end of the time domain in theory
t6=(0:(2*N-2))*T;
st3_fft=abs(fftshift(fft(st3,L))); %Look at the spectrum of the output signal after convolution
figure(5);
subplot(4,1,1);plot(t1,wave_no_fit);title('Time domain diagram of unmatched signal') %Time domain diagram of input signal
subplot(4,1,2);plot(t1,ht3);title('Matched Filter Time Domain Diagram of Carrier 1') % Time Domain Diagram of Matched Filter
subplot(4,1,3);plot(t6,st3);title('output signal time domain diagram') % time domain diagram of output signal
subplot(4,1,4);plot(f,st3_fft);title('output signal spectrogram') % spectrum of output signal
%The following is to demodulate the BPSK signal by using the matched filter to design the best receiver. -------------------------------------------------- --------------------------------
%Assume that the input signal is a known signal, know the symbol width and the starting point, and perform a matched filter every 200 points.
ht_psk_1=fliplr(carry_wave_1); % The matched filter impulse response of carrier 1.
ht_psk_2=fliplr(carry_wave_2); % The matched filter impulse response of carrier 2.
y=[];
st_psk_1_show=[];
st_psk_2_show=[];
for i=1:length(digital_signal)
for j=1:N
psk_single(j)=psk_wave((i-1)*N + j); %White noise can be added here, any large value will not affect the judgment result.
end
st_psk_1=conv(psk_single,ht_psk_1);
st_psk_2=conv(psk_single,ht_psk_2); % Use two matched filters to filter the input BPSK signal
if st_psk_1(N)>st_psk_2(N) % sampling decision
y(i)=1;
else
y(i)=0;
end
st_psk_1_show=[st_psk_1_show,st_psk_1];
st_psk_2_show=[st_psk_2_show,st_psk_2];
end
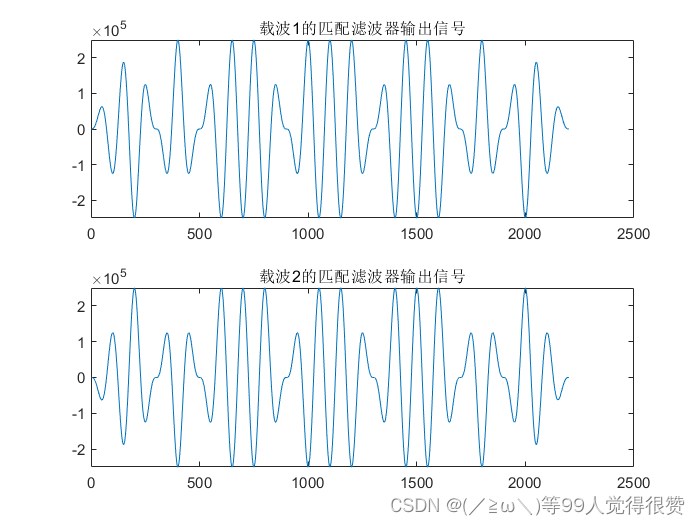
% Pass the output signals of the two matched filters respectively
figure(6);
subplot(2,1,1);plot(st_psk_1_show); title('Matched filter output signal of carrier 1');
subplot(2,1,2);plot(st_psk_2_show); title('Matched filter output signal of carrier 2');
%Output the digital signal demodulated by the matched filter
the y
%Assume that the input signal is a known signal, know the symbol width and the starting point, and perform a matched filter for each input point. -------------------------------------------------- --
ht_psk_1=fliplr(carry_wave_1); % The matched filter impulse response of carrier 1.
ht_psk_2=fliplr(carry_wave_2); % The matched filter impulse response of carrier 2.
%Add N zeros at the end of psk_wave
psk_wave_extend=[];
for i=1:(length(digital_signal)*N + N)
if i>=1 & amp; & amp; i<=length(digital_signal)*N
psk_wave_extend(i)=psk_wave(i);
else
psk_wave_extend(i)=0;
end
end
%Temporary variable initial setting N 0
psk_temp_1=[];
for i=1:N + 1
psk_temp_1(i)=0;
end
% Every time a psk data is input, a matched filter is performed
psk_temp_2=[];
st_psk_3=[]; % matched filtered signal
st_psk_3_N=[]; % Take out the Nth data from each matched filtered signal
st_psk_4=[]; %matched filtered signal
st_psk_4_N=[]; % Take out the Nth data from each matched filtered signal
for i=1:(length(digital_signal)*N + N)
for j=1:N
psk_temp_1(j)=psk_temp_1(j + 1); %The data in the temporary array is shifted to the left by one
end
psk_temp_1(j)=psk_wave_extend(i); %The last digit is added to psk signal input
for k=1:N
psk_temp_2(k)=psk_temp_1(k); % Take out the first N bits of data for matched filtering
end
st_psk_3=conv(psk_temp_2,ht_psk_1);
st_psk_3_N(i)=st_psk_3(N); % Only take out the value of the matching filter energy concentration point N
st_psk_4=conv(psk_temp_2,ht_psk_2);
st_psk_4_N(i)=st_psk_4(N);
end
for i=1:length(digital_signal) %demodulate the digital signal
if st_psk_3_N(i*N)>st_psk_4_N(i*N)
z(i)=1;
else
z(i)=0;
end
end
figure(7);
subplot(2,1,1);plot(st_psk_3_N); title('Matched filter output signal of carrier 1');
subplot(2,1,2);plot(st_psk_4_N); title('Matched filter output signal of carrier 2');
% output demodulated digital signal
z


Successful demodulation, extremely immune to noise
I am original, for reference only, like it, welcome to discuss