We have an online project that occupied more than 1.5G just after it was started. Use the top command to check that RES occupied more than 1.5G. This is obviously unreasonable, so we did some analysis and found the root cause. The following is the complete analysis process. I hope it will help. You helped.
The following content will be involved
-
Linux classic 64M memory problem
-
Basic routines for heap memory analysis and Native memory analysis
-
The use of tcmalloc and jemalloc in native memory analysis
-
finalize principle
-
hibernate is tireless
Phenomena
Program startup parameters
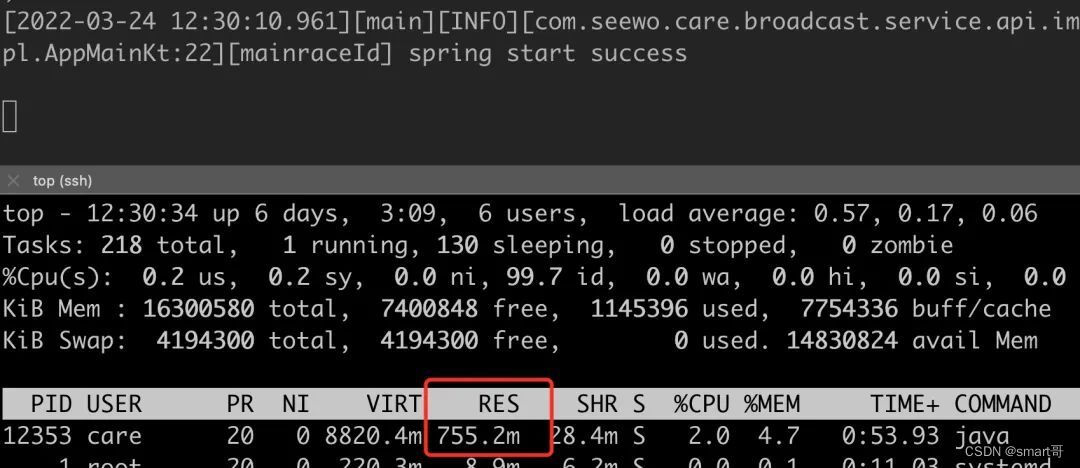
ENV=FAT java
-Xms1g -Xmx1g
-XX:MetaspaceSize=120m
-XX:MaxMetaspaceSize=400m
-XX: + UseConcMarkSweepGC
-jar
EasiCareBroadCastRPC.jar
After startup, the memory usage is as follows, an astonishing 1.5G. Java is a big memory user, but don’t play like this.
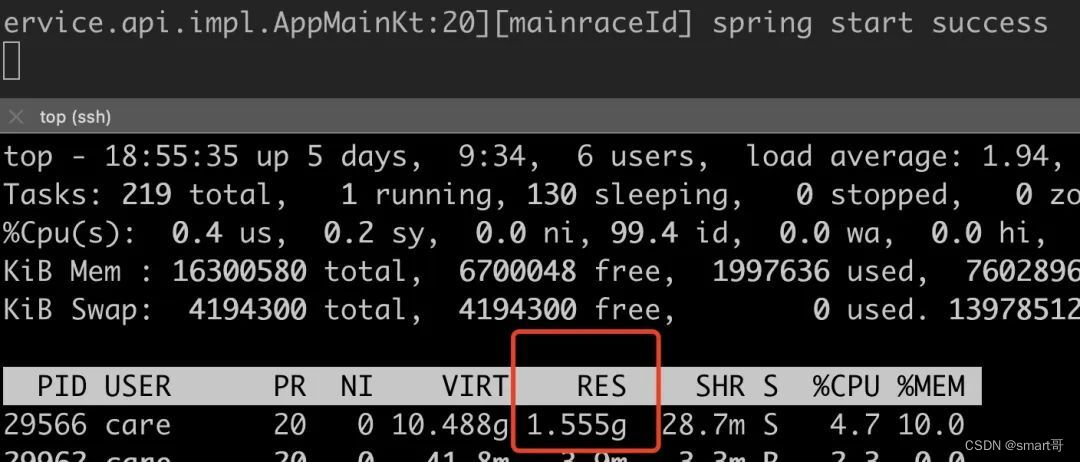
What follows is a pleasant analysis process.
Pick the soft persimmons first
First check whether the heap memory usage is relatively high through jcmd or jmap. If this is the problem, it can be solved quickly.
You can see that the heap memory occupies 216937K + 284294K = 489.48M. Although the Metaspace memory does not belong to the Java heap, it is also shown here that it occupies 80M +. The two parts combined are far from 1.5G. ?
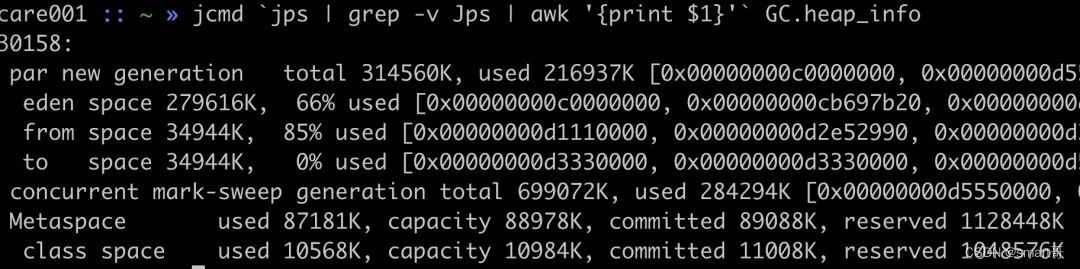
Where did the rest of the memory go? At this point, you can already know that memory may be occupied by parts other than the heap. The next step is to start using NativeMemoryTracking for the next step of analysis.
NativeMemoryTracking usage
If you want to track the memory usage of other parts, you need to enable this feature through -XX:NativeMemoryTracking
java -XX:NativeMemoryTracking=[off | summary | detail]
Add this startup parameter, restart the process, and then use jcmd to print relevant information.
$ jcmd `jps | grep -v Jps | awk '{print $1}'` VM.native_memory detail

Total: reserved=2656938KB, committed=1405158KB
- Java Heap (reserved=1048576KB, committed=1048576KB)
                            (mmap: reserved=1048576KB, committed=1048576KB)

- Class (reserved=1130053KB, committed=90693KB)
                            (classes #15920)
                            (malloc=1605KB #13168)
                            (mmap: reserved=1128448KB, committed=89088KB)

- Thread (reserved=109353KB, committed=109353KB)
                            (thread #107)
                            (stack: reserved=108884KB, committed=108884KB)
                            (malloc=345KB #546)
                            (arena=124KB #208)

- Code (reserved=257151KB, committed=44731KB)
                            (malloc=7551KB #9960)
                            (mmap: reserved=249600KB, committed=37180KB)

- GC (reserved=26209KB, committed=26209KB)
                            (malloc=22789KB #306)
                            (mmap: reserved=3420KB, committed=3420KB)

- Compiler (reserved=226KB, committed=226KB)
                            (malloc=95KB #679)
                            (arena=131KB #7)

- Internal (reserved=15063KB, committed=15063KB)
                            (malloc=15031KB #20359)
                            (mmap: reserved=32KB, committed=32KB)

- Symbol (reserved=22139KB, committed=22139KB)
                            (malloc=18423KB #196776)
                            (arena=3716KB #1)
I am very disappointed. All the parts displayed here look normal, and there is no particularly large abnormal occupancy. At this point, we can basically know that there is a problem with the native memory that is not controlled by the JVM. So how to analyze it?
pmap preliminary view
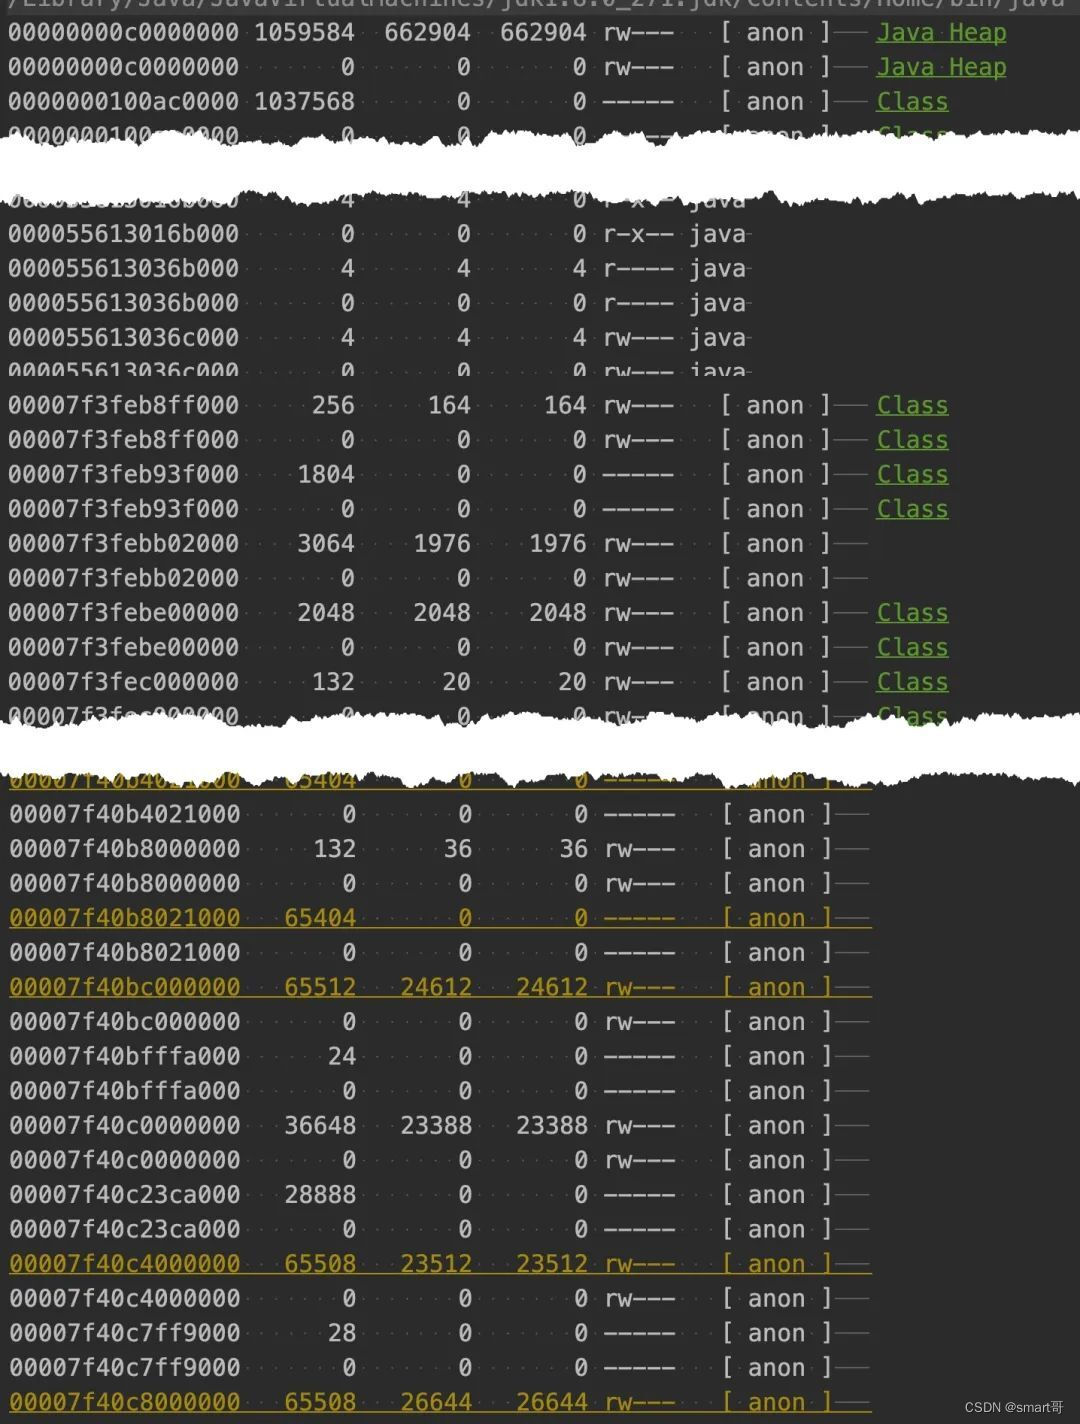
Through pmap, we can check the memory distribution of the process. We can see that there are a large number of 64M memory block areas. This part is a typical phenomenon of linux memory ptmalloc. This problem was discussed in the previous article “A Java Process OOM Troubleshooting Analysis (glibc article) )” has been introduced. For details, please see: https://juejin.cn/post/6854573220733911048
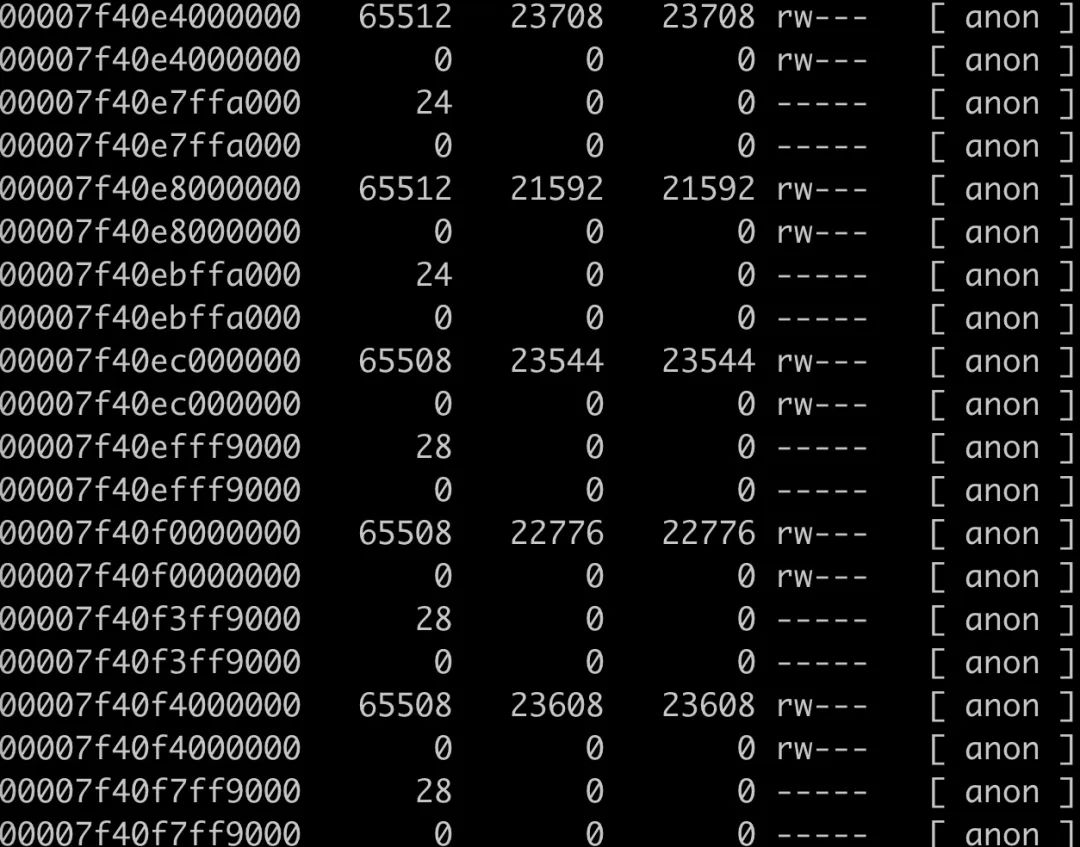
So is this 64M memory area block in the memory area counted by NMT above?
The address output detail mode of the NMT tool will output the start and end addresses of each area, as shown below.
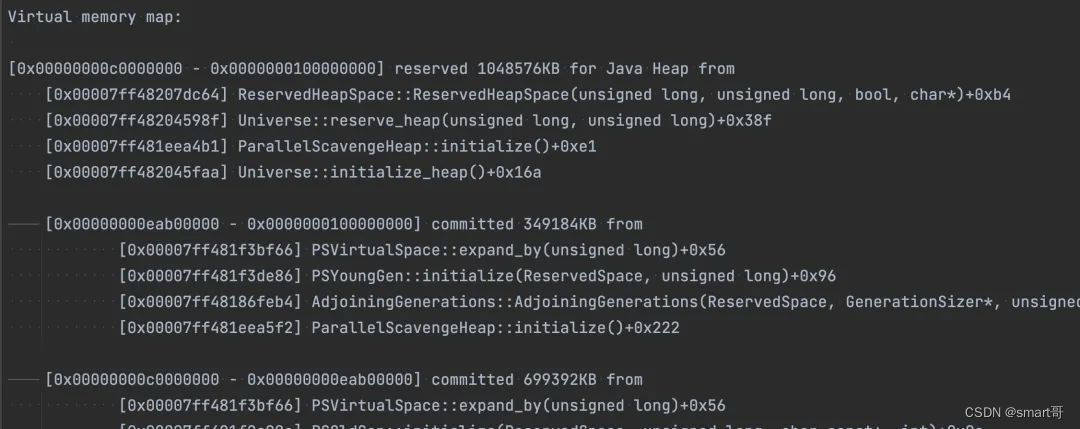
By writing a simple code (just do it yourself), you can integrate the pmap and nmt parts and see which part of the memory address space the real heap, stack, GC, etc. memory usage is distributed in.
You can see that a large 64M portion of the memory area does not belong to any NMT jurisdiction.
tcmalloc and jemalloc come to the rescue
We can use tcmalloc or jemalloc to track native memory allocation. Their principles are the implementation of memory application release functions such as hook system malloc and free, and add profile logic.
Take tcmalloc as an example below.
Compile tcmalloc from the source code (http://github.com/gperftools/gperftools), and then use LD_PRELOAD to hook the memory allocation and release function.
HEAPPROFILE=./heap.log
HEAP_PROFILE_ALLOCATION_INTERVAL=104857600
LD_PRELOAD=./libtcmalloc_and_profiler.so
java -jar xxx ...
During the startup process, you will see that many memory dump analysis files have been generated. Next, use pprof to convert the heap file into a more readable pdf file.
pprof --pdf /path/to/java heap.log.xx.heap > test.pdf
The link for memory application is shown in the figure below.
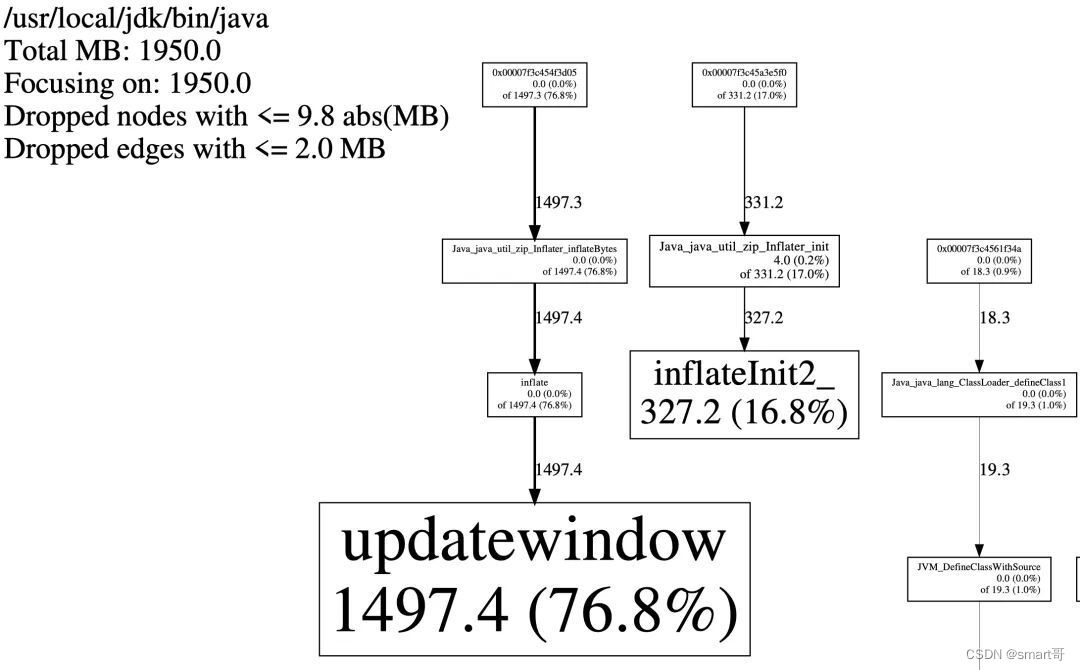
It can be seen that most of the memory applications are consumed in Java_java_util_zip_Inflater_inflateBytes. The jar package is essentially a zip package. In the process of reading the jar package file, a large amount of cpp code in jni is used for processing. This A large number of applications inside free up memory.
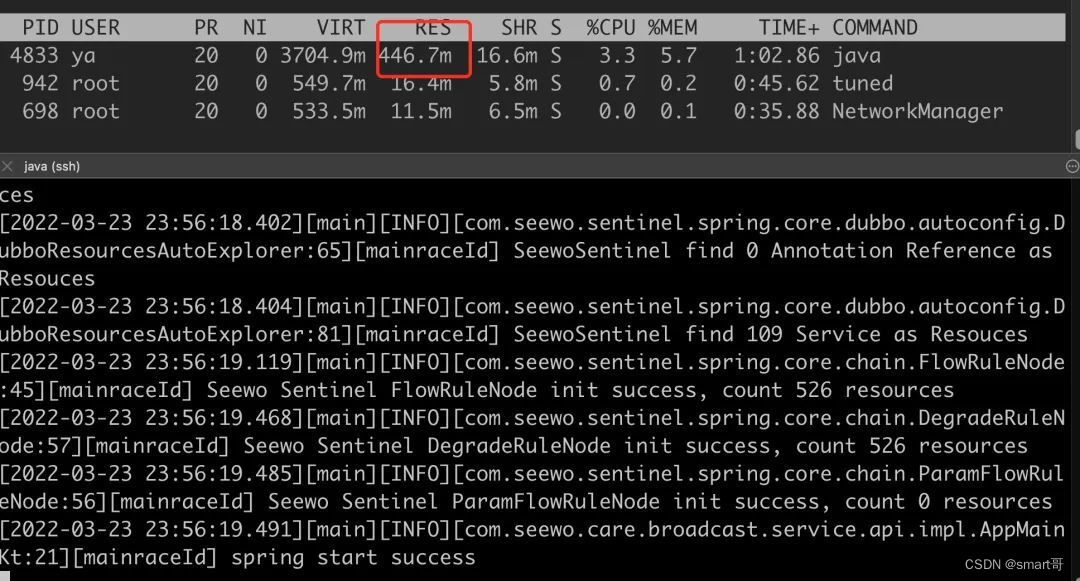
Solution without changing the code
Since the memory is so large due to reading the zip file of the jar package, I don’t need to use java -jar, but directly decompress the original jar package, and then use java -cp . AppMain Can this problem be avoided by starting? Because our project uses shade for historical reasons, there are no jar packages in it anymore, all are class files. A miracle happened, no jar package is needed to start, RES only takes up 400M, it’s not magical!
At this point, we are more certain that the problem is caused by the startup of the jar package. So why does the startup of the jar package cause problems?
Exploring root causes
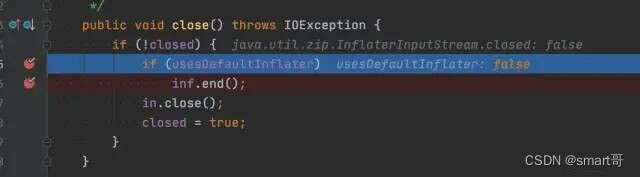
Through tcmalloc, you can see that a large number of applications for memory release are in the java.util.zip.Inflater class. Calling its end method will release native memory.
I thought it was caused by the end method not being called. This is indeed possible. The close method of the java.util.zip.InflaterInputStream class will not call the Inflater.end method in some scenarios, as shown below.
However, the Inflater class implements the finalize method. After the Inflater object becomes unreachable, the JVM will help call the finalize method of the Inflater class.
public class Inflater {

    public void end() {
        synchronized (zsRef) {
            long addr = zsRef.address();
            zsRef.clear();
            if (addr != 0) {
                end(addr);
                buf = null;
            }
        }
    }

    /**
     * Closes the decompressor when garbage is collected.
     */
    protected void finalize() {
        end();
    }

    private native static void initIDs();
    // ...
    private native static void end(long addr);
}
There are two possibilities
-
Inflater cannot be released because it is referenced by other objects. As a result, the finalize method cannot be called and the memory cannot be released.
-
Inflater’s finalize method is called, but it is cached by libc’s ptmalloc and cannot actually be released back to the operating system.
The second possibility has been introduced before in another article “Troubleshooting and Analysis of a Java Process OOM (glibc)”. For details, please see: https://juejin.cn/post/6854573220733911048. It has been verified that it is not the case. this problem.
Let’s look at the first possibility, by dumping the heap memory. Sure enough, 8 Inflater objects are still alive and have not been GCed. In addition to being referenced by the java.lang.ref.Finalizer inside the JVM, there are other references, which makes the Inflater unable to be recycled during GC.
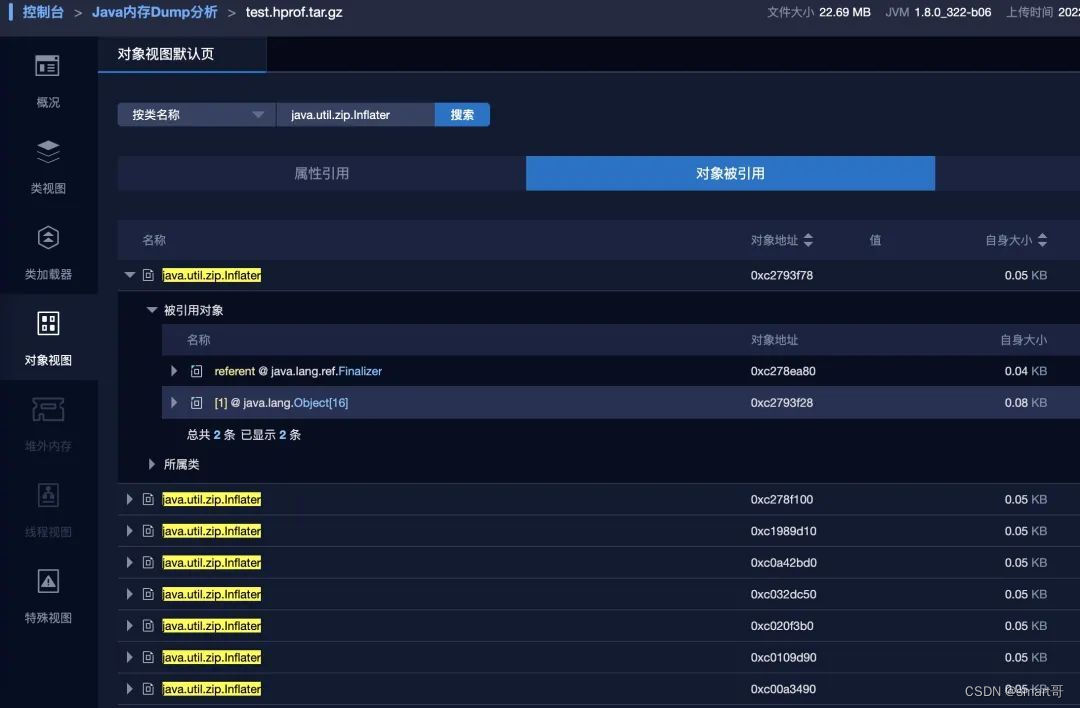
So are these memories really related to the 64M memory block? It’s empty talk, let’s confirm it. The Inflater class has a zsRef field, which is actually a pointer address. Let’s see if the zsRef address of the unreleased Inflater is located in the so-called 64M memory block.
public class Inflater {
    private final ZStreamRef zsRef;
}

class ZStreamRef {
    private volatile long address;
    ZStreamRef (long address) {
        this.address = address;
    }

    long address() {
        return address;
    }

    void clear() {
        address = 0;
    }
}
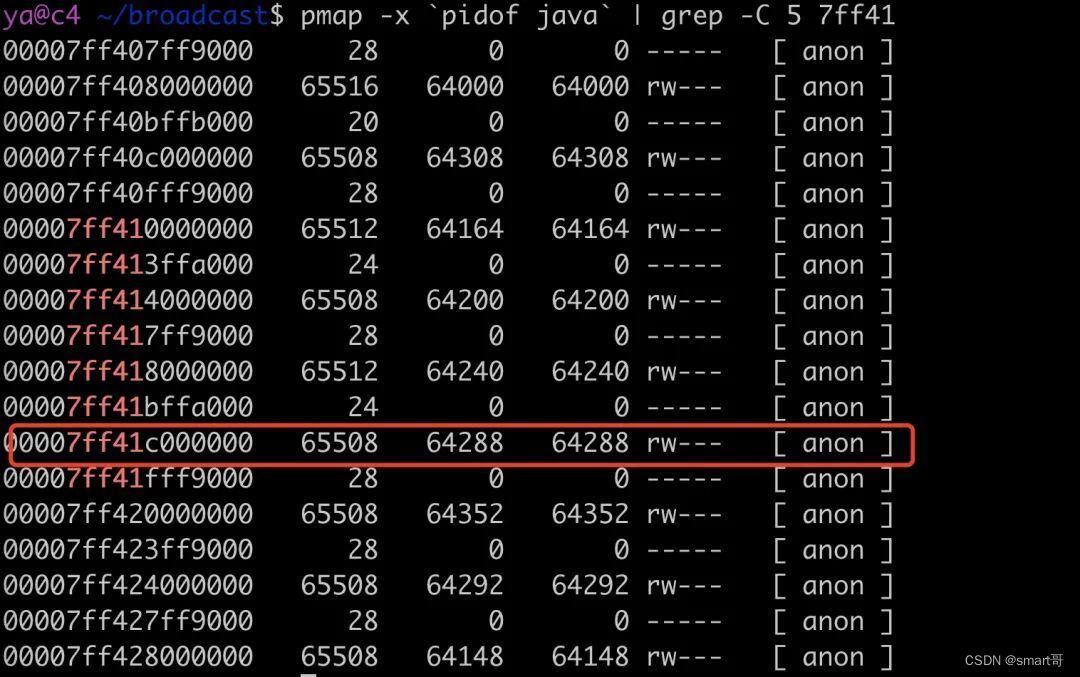
Find the address equal to 140686448095872 through a ZStreamRef, which is converted to hexadecimal 0x7ff41dc37280. The virtual address space where this address is located is here:
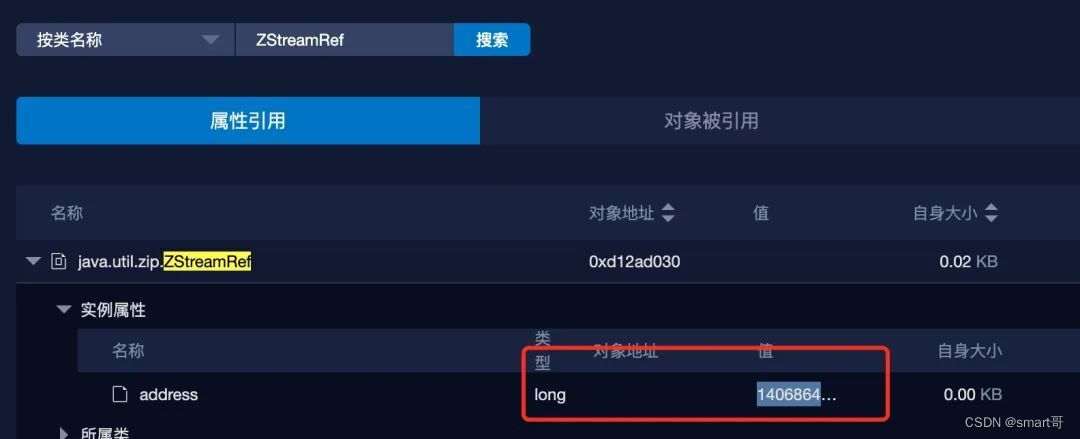
It’s in what we call a 64M memory block.
If you still don’t believe it, we can dump this memory. I wrote a script here
cat /proc/$1/maps | grep -Fv ".so" | grep " 0 " | awk '{print $1}' | grep $2 | ( IFS="-"
while read a b; do
dd if=/proc/$1/mem bs=$( getconf PAGESIZE ) iflag=skip_bytes,count_bytes \
skip=$(( 0x$a )) count=$(( 0x$b - 0x$a )) of="$1_mem_$a.bin"
done )
By passing in the process number and the starting address of the memory you want to dump, you can dump this memory.
./dump.sh `pidofjava` 7ff41c000000
Execute the above script and pass in two parameters, one is the process id and the other is the address. A 64M memory dump file will be generated, which can be viewed through strings.
strings 6095_mem_7ff41c000000.bin
The output result is as follows. The screen is filled with information related to class files.
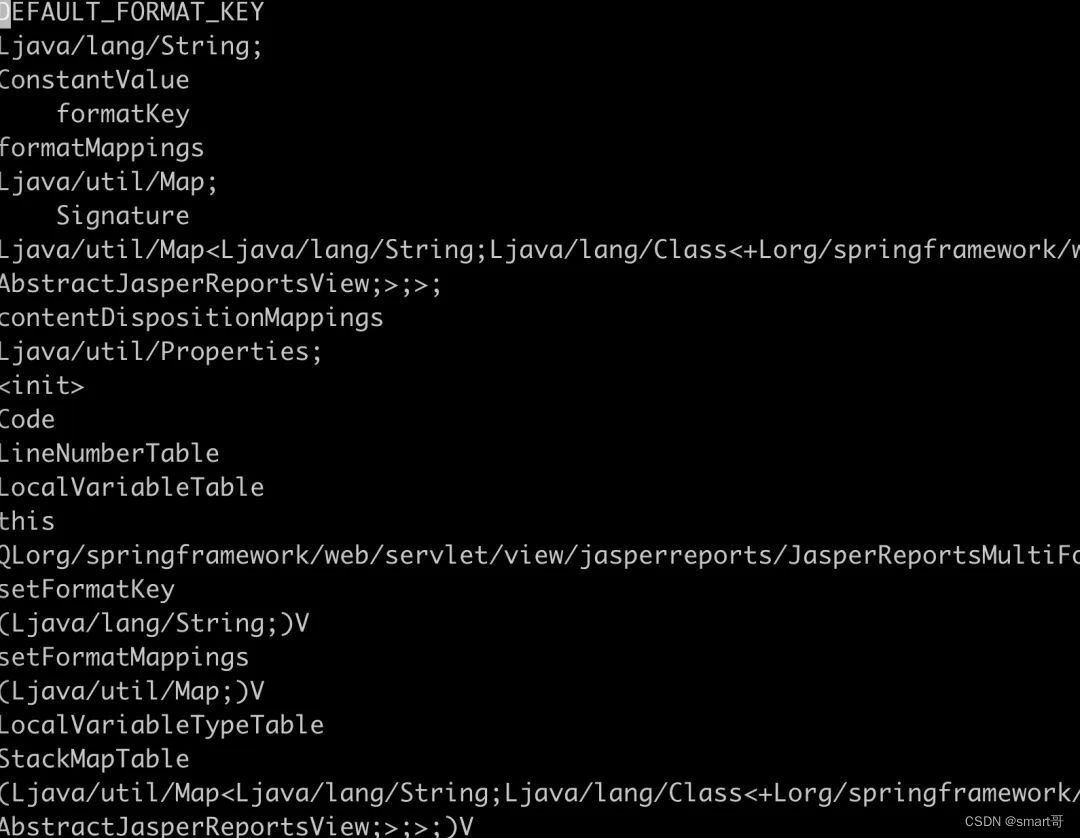
There should be no need to prove anything at this point, the rest is a matter of analysis.
So who was it quoted by? Expand the reference chain and see a bunch of ClassLoaders appearing.
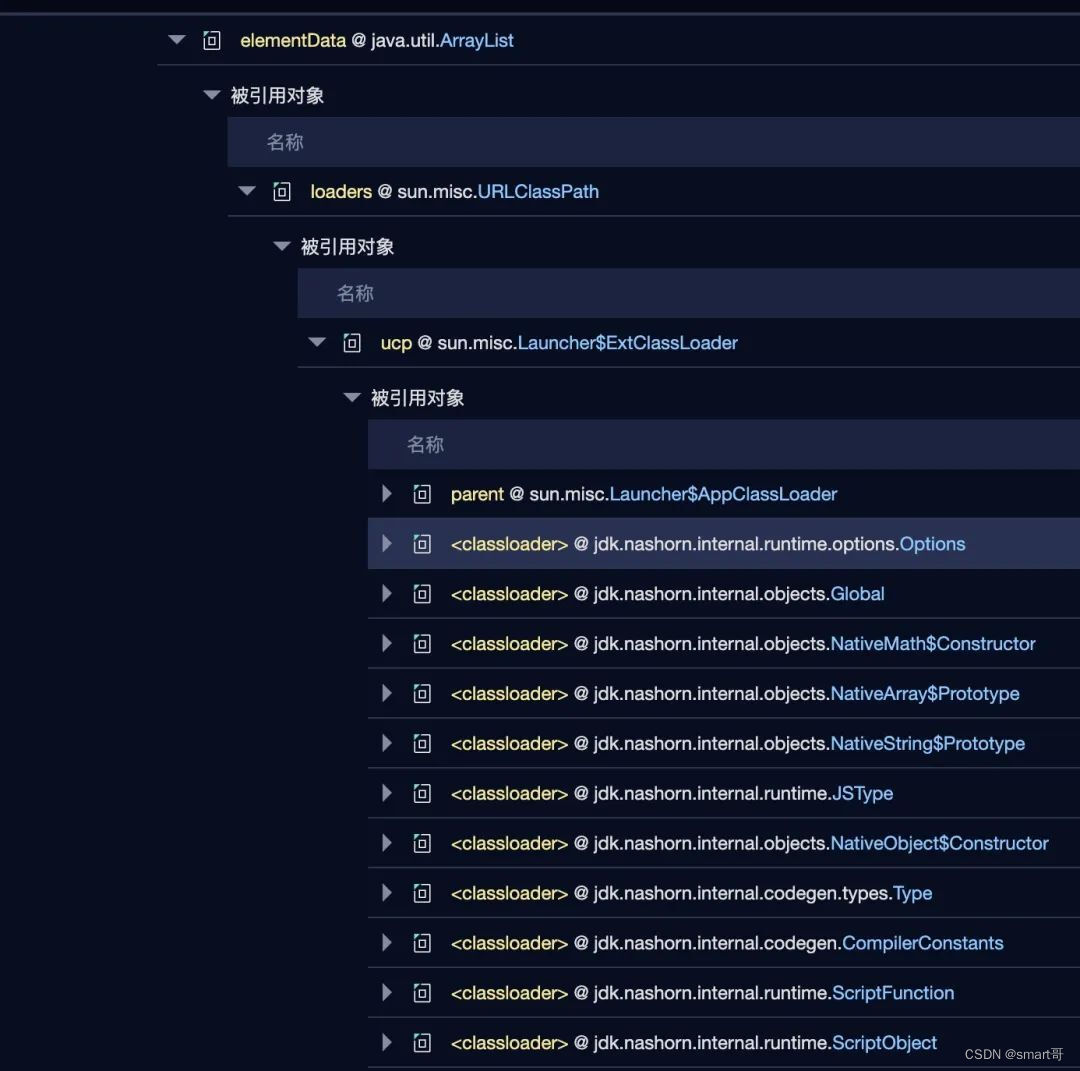
An unexpected discovery (it has little to do with this problem, let’s solve it easily)
A very strange nashorn-related ClassLoader appears here. As we all know, nashorn handles JavaScript-related logic, so why does this project use nashorn? After careful searching, the project code is not used.
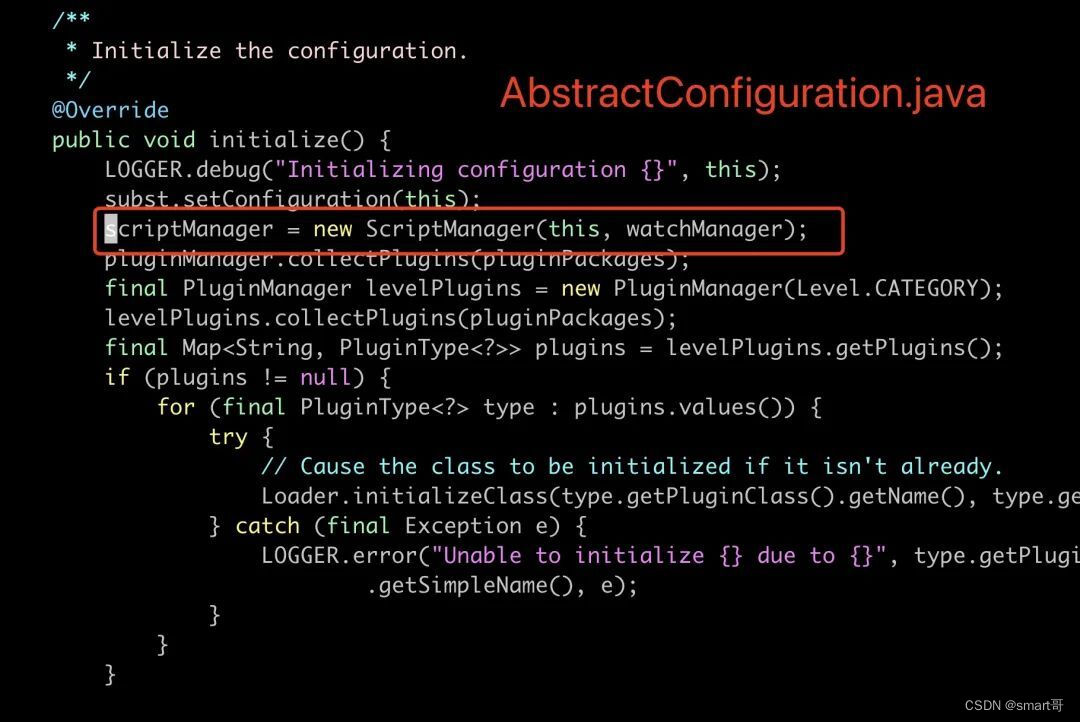
Which pitfall middleware was introduced? After debugging, I immediately found the reason. It turned out to be the notorious log4j2. After using log4j for so many years, I learned for the first time that log4j2 supports scripting languages such as javaScript and Groovy.
<?xml version="1.0" encoding="UTF-8"?>
<Configuration status="debug" name="RoutingTest">
  <Scripts>
    <Script name="selector" language="javascript"><![CDATA[
            var result;
            if (logEvent.getLoggerName().equals("JavascriptNoLocation")) {
                result = "NoLocation";
            } else if (logEvent.getMarker() != null & amp; & amp; logEvent.getMarker().isInstanceOf("FLOW")) {
                result = "Flow";
            }
            result;
            ]]></Script>
    <ScriptFile name="groovy.filter" path="scripts/filter.groovy"/>
  </Scripts>
</Configuration>
We don’t use similar features in our project (because we don’t know). I can only say that I am speechless. Why don’t you just be a tool log library? Doing so many fancy things is superficial!
code here
I took a quick look at this issue. As of the latest official version, there is no switch to turn off ScriptEngine. If it doesn’t work, just do it yourself. Pull the code corresponding to the log4j version in the project, make modifications, repackage and run.
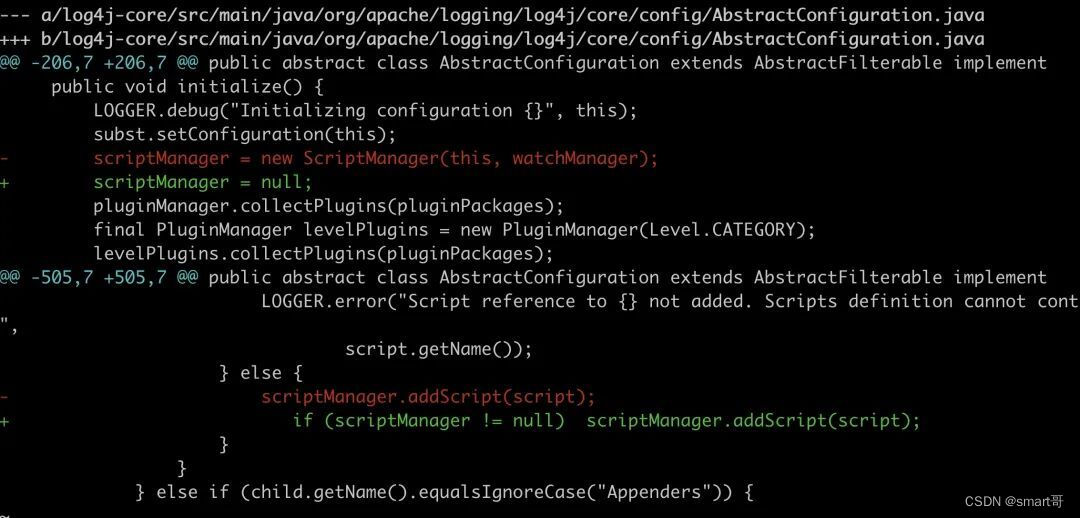
After re-running, the ClassLoader in the nashorn part is indeed gone, but this is just a small episode, and the problem of native memory usage has not been solved.
The murderer surfaced
Next we have to find out which code is calling the java.util.zip.Inflater.inflateBytes method like crazy
Use watch to jstack the thread every second, and you will immediately see hibernate making crazy calls.
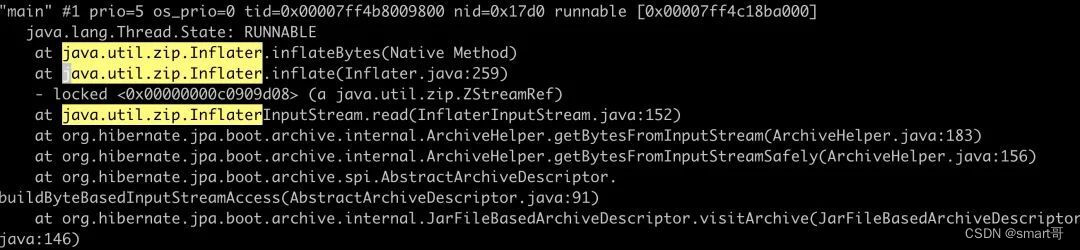
hibernate is a remnant of our historical old code and has not been removed. It seems that it is still a trap.
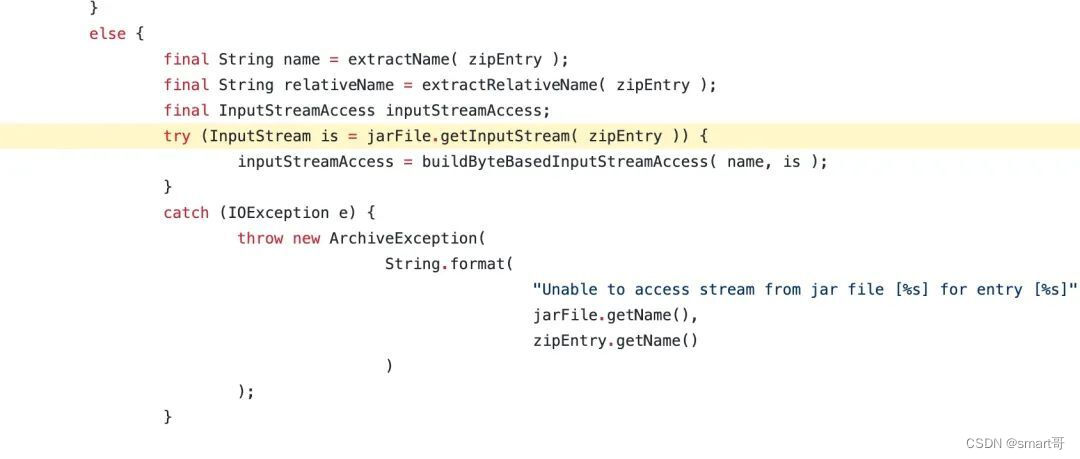
Find the code corresponding to this function org.hibernate.jpa.boot.archive.internal.JarFileBasedArchiveDescriptor#visitArchive#146
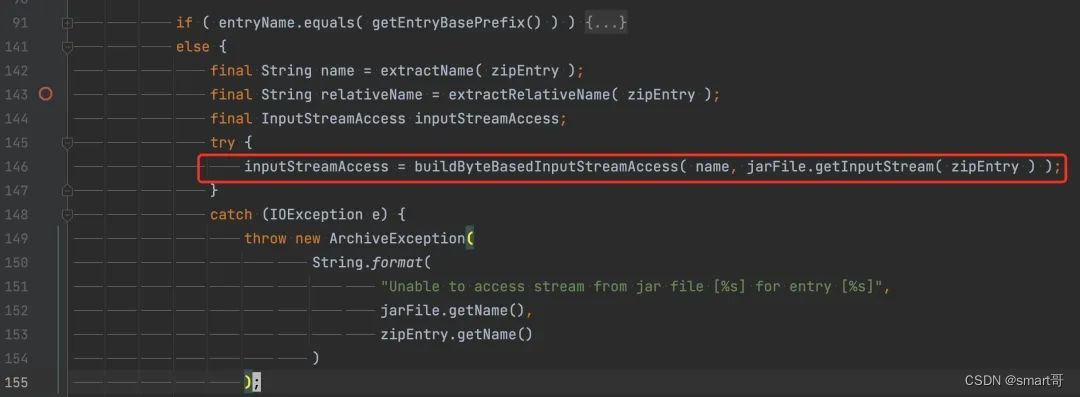
Garbage code, jarFile.getInputStream( zipEntry ) generates a new stream but does not close it.
In fact, I don’t know why hibernate wants to scan and parse all the classes in my jar package. It’s completely wrong.
Let’s extract this code and write a minimalist demo.
public class JarFileTest {
    public static void main(String[] args) throws IOException {
        new JarFileTest().process();
        System.in.read();
    }

    public static byte[] getBytesFromInputStream(InputStream inputStream) throws IOException {
        // Omit the logic of read
        return result;
    }

    public void process() throws IOException {
        JarFile jarFile = null;
        try {
            jarFile = new JarFile("/data/dev/broadcast/EasiCareBroadCastRPC.jar");
            final Enumeration<? extends ZipEntry> zipEntries = jarFile.entries();
            while (zipEntries.hasMoreElements()) {
                final ZipEntry zipEntry = zipEntries.nextElement();
                if (zipEntry.isDirectory()) {
                    continue;
                }

                byte[] bytes = getBytesFromInputStream(jarFile.getInputStream(zipEntry));

                System.out.println("processing: " + zipEntry.getName() + "\t" + bytes.length);
            }
        } finally {
            try {
                if (jarFile != null) jarFile.close();
            } catch (Exception e) {
            }
        }
    }
}
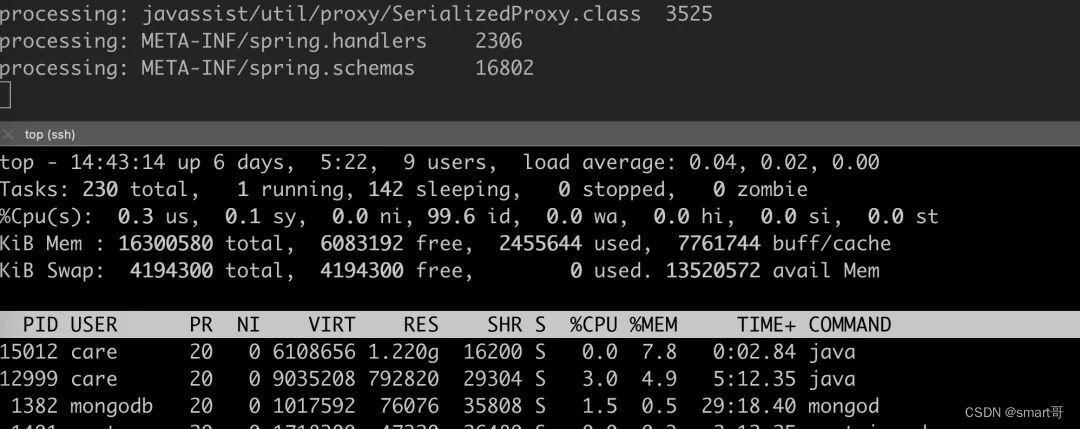
Run the above code.
javac JarFileTest.java
java -Xms1g -Xmx1g -XX:MetaspaceSize=120m -XX:MaxMetaspaceSize=400m -XX: + UseConcMarkSweepGC -cp . JarFileTest
The memory RES occupation immediately soared to more than 1.2G, and GC cannot recycle it anyway, but the heap memory is almost equal to 0.
RES memory usage is shown below.
The heap memory occupancy is as follows. After GC, the new generation occupancy is 0 and the old generation occupancy is 275K
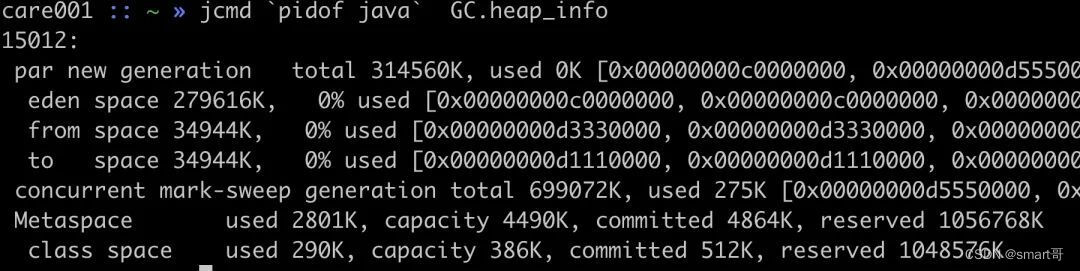
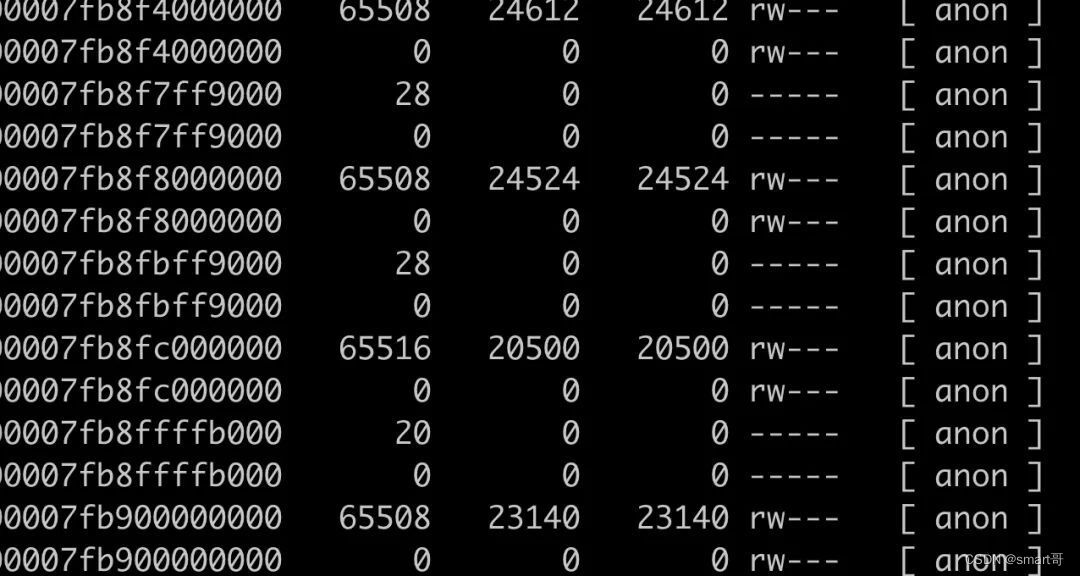
All 64M of memory are occupied.
Close the stream by modifying the code
while (zipEntries.hasMoreElements()) {
    final ZipEntry zipEntry = zipEntries.nextElement();
    if (zipEntry.isDirectory()) {
        continue;
    }

    InputStream is = jarFile.getInputStream(zipEntry);
    byte[] bytes = getBytesFromInputStream(is);

    System.out.println("processing: " + zipEntry.getName() + "\t" + bytes.length);
    try {
        is.close();
    } catch (Exception e) {

    }
}
After testing again, the problem was solved and the native memory usage almost disappeared. The next step is to solve the problems in the project. One is to completely remove hibernate and replace it with the mybatis we are using now, which I don’t know how to do. I plan to change the source code of hibernate.
Try to modify
Modify this code (ps this is an immature change, close should be placed in finally, multiple closes need to catch exceptions separately, but for the sake of simplicity, we will simplify it here) and add the logic of close.
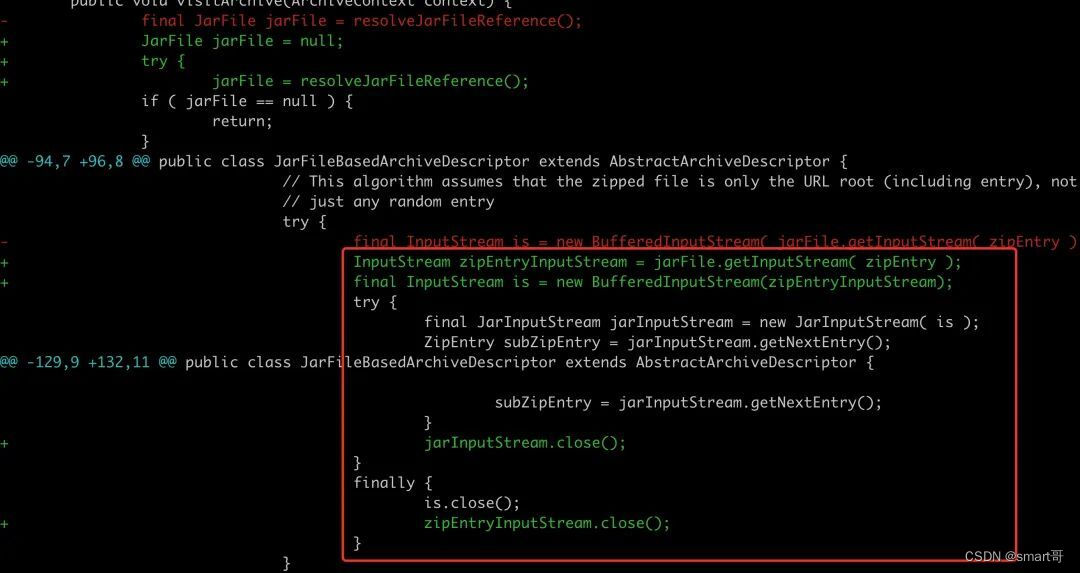
Recompile hibernate, install it locally, and then repackage and run it. At this time, the RES usage dropped from about 1.5G to more than 700M.
What’s more gratifying is that the native memory footprint of the 64M block is very, very small. Of the 700M memory here, 448M is the dirty heap area. This part is only reserved by the JVM.
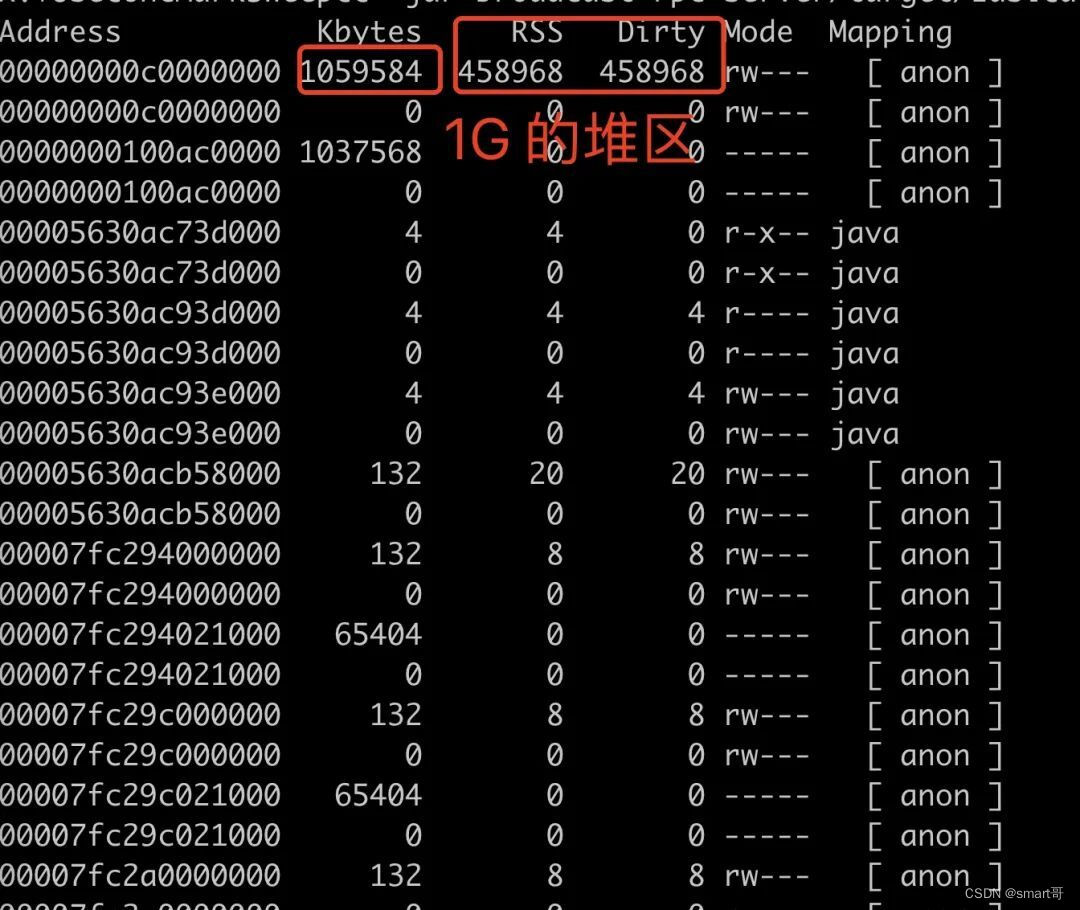
At this point, we have basically solved the problem. Later I took a look at the source code of hibernate. In the new version, this problem has been solved, but I don’t plan to upgrade, so I’m done.
For details, see:
https://github.com/hibernate/hibernate-orm/blob/72e0d593b997681125a0f12fe4cb6ee7100fe120/hibernate-core/src/main/java/org/hibernate/boot/archive/internal/JarFileBasedArchiveDescriptor.java#L116
Postscript
Because it is not the focus of this article, I have not discussed the use of some of the tools involved in the article. If you are interested, you can handle it yourself.
In fact, native memory leaks are not as complicated as we imagined. They can be analyzed step by step through NMT, pmap, and tcmalloc. As long as they can be reproduced, they are not called bugs.
Finally, cherish life and stay away from hibernate.