1. Download the echarts.js file from the official website
1.1 Echart official website: Download – Apache ECharts
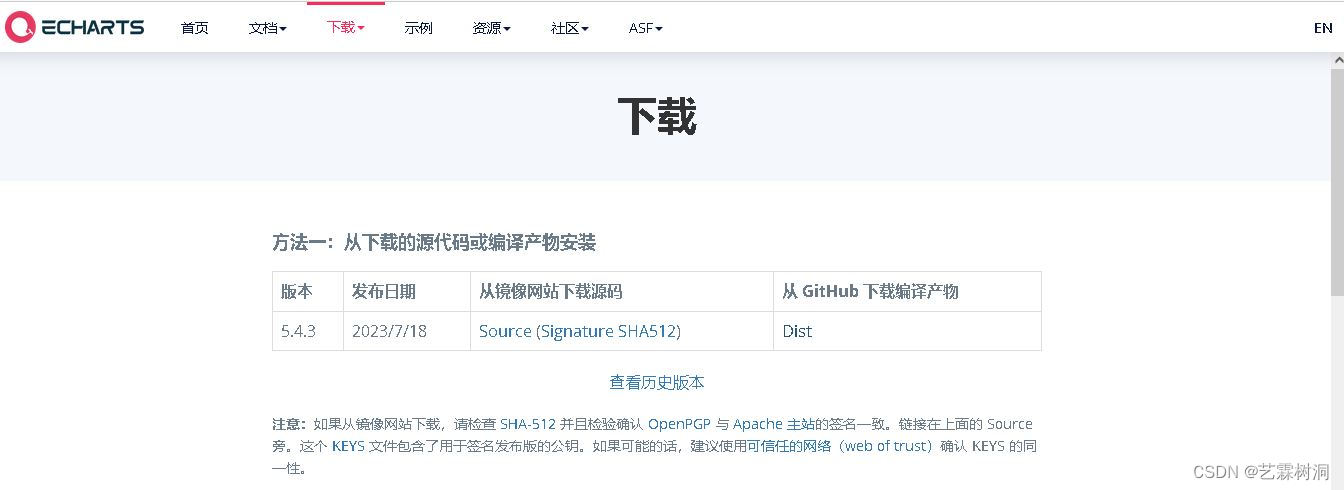
1.2 Drag the downloaded echarts.js file to the same directory as the html file
2. Use Python to implement data file format conversion (.xlsx-.json)
2.1 Reasons for converting data format
PM2.5 monitoring data: 30 days a month, monitoring from 8:00 to 18:00.
There is a lot of data, and it is unrealistic to enter it one by one. The data format needs to be converted from excel to json format. This can be directly referenced by html using “script”.
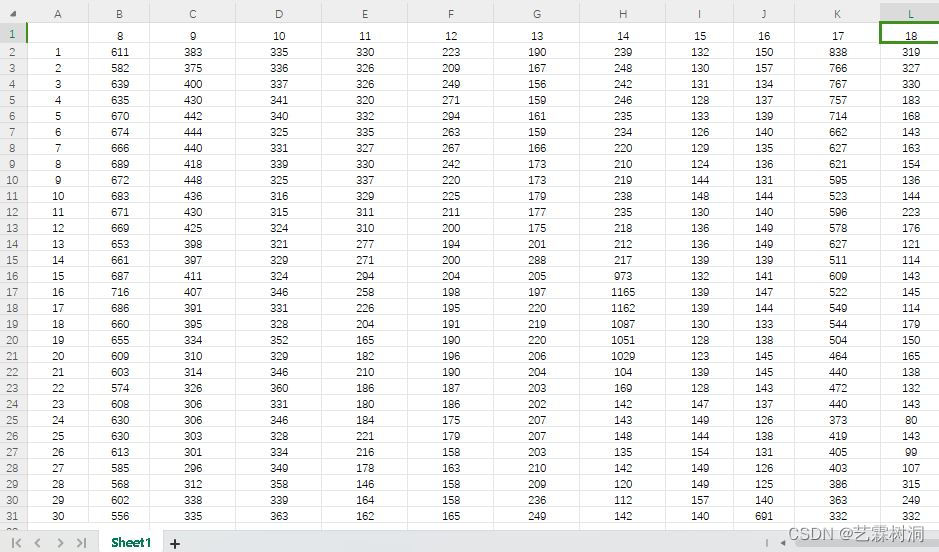
Figure 2-1 Monitoring data excel table
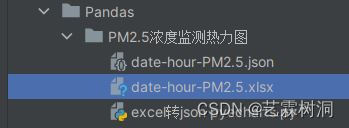
2.2 Python for format conversion
Place it in the same level directory and just write the file name in the path.
code show as below:
# coding: utf-8
import pandas as pd

df =pd.read_excel('date-hour-PM2.5.xlsx')
print(df.head())
data = df.to_json(orient='records')
import json
with open('date-hour-PM2.5.json','w') as f:
    json.dump(data,f)
The json file output by orient =’records’ is in the form of “key-value pairs”.
operation result:
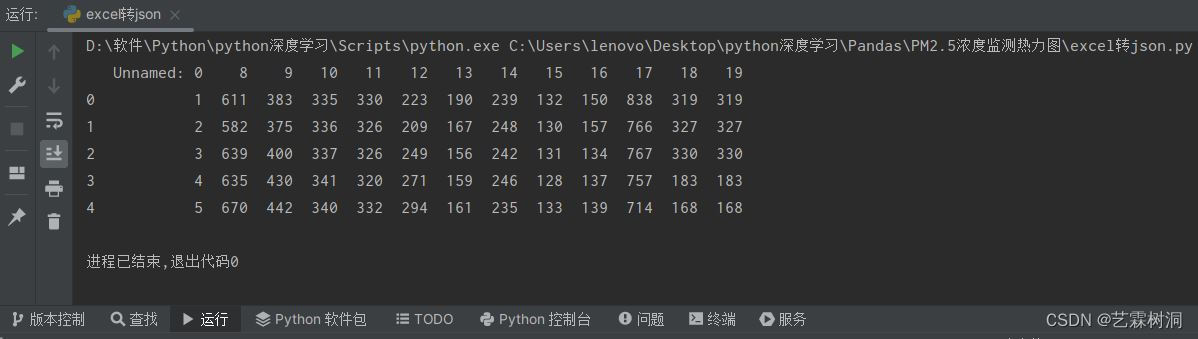
It is normal for only 5 lines to be displayed, and the generated “.json” file will appear directly in the sibling directory on the left.
3. HTML refers to data drawing in json format
You can use editors such as VS code and PhpStorm.
The html code is as follows:
<!DOCTYPE html>
<html lang="en">

    <head>
        <meta charset="UTF-8">
        <script src="echarts.js"></script>
        <meta name="viewport" content="width=device-width, initial-scale=1.0">
        <title>PM2.5 concentration monitoring heat map</title>
    </head>

    <body>
        <!--Prepare a DOM with size (width and height) for ECharts-->
        <div id="main" style="width: 700px;height: 750px;"></div>
        <script type="text/javascript">
            var myCharts = null;
            var hours = ['8', '9', '10', '11', '12', '13', '14', '15\ ', '16', '17', '18'];
            var days = ['1', '2', '3', '4', '5', '6', '7', '8\ ', '9', '10', '11',
                        '12', '13', '14', '15', '16', '17', '18', '19', ' 20',
                        '21', '22', '23', '24', '25', '26', '27', '28', ' 29', '30'];
            let jsonFiles = ['data_change.json'];

            function getJsonData(path) {
                var xmlhttp = new XMLHttpRequest();
                var url = path;
                xmlhttp.onreadystatechange = function () {
                    if (xmlhttp.readyState == 4 & amp; & amp; xmlhttp.status == 200) {
                        var myArr = JSON.parse(xmlhttp.responseText); //Here is the json data obtained
                        initEchart(JSON.parse(myArr)); //
                    }
                }
                xmlhttp.open("GET", url, true);
                xmlhttp.send();
            }
            function myFunction(arr) {
                console.log(arr); // The console here prints the obtained json data
            }
            function initEchart(data) {
                console.log(data, Object.prototype.toString.call(data))
                if (!myCharts) {
                    //Based on the prepared DOM, initialize the ECharts instance
                    myCharts = echarts.init(document.getElementById('main'));
                }
                let mapData = [];
                data.forEach( (y,i) => {
                    hours.forEach(x => {
                        mapData.push([x, days[i], y[x]])
                    })
                })
                console.log('mapData', mapData)
                option = {
                    tooltip: {
                        position: 'top'
                    },
                    toolbox:{
                        show:true,
                        feature:{
                            mark: {show:true},
                            dataView:{show:true},
                            magicType:{show:true, type:['line','heatmap']},
                            restore:{},
                            saveAsImage:{}
                        }
                    },
                    title:{
                        text:'PM2.5 concentration monitoring',
                        subtext:'Heat map',
                        left:'center'
                    },
                    Animation: false,
                    grid: {
                        height: '50%', //Control the vertical width ratio of the heat map
                        top: '8%' //Percentage of distance from the top of the heat map
                    },
                    xAxis: {
                        name:'Hour (point)',
                        type: 'category',
                        data: hours, //Hours as the horizontal axis
                        splitArea: {
                            show: true
                        }
                    },
                    yAxis: {
                        name:'Date (day)',
                        type: 'category',
                        data: days, //week as vertical axis
                        splitArea: {
                            show: true
                        }
                    },
                    visualMap: {
                        min: 80, //Minimum value of the slider
                        max: 1165, //Maximum value of the slider
                        calculable: true, //The slider displays the value
                        orient: 'horizontal', //The slider is placed horizontally and vertically by default.
                        left: 'center', //The slider is centered
                        bottom: '28%' //The percentage distance between the slide bar and the bottom
                    },
                    series: [
                        {
                            name: 'PM2.5 concentration monitoring',
                            type: 'heatmap', //heat map
                            data: mapData,
                            label: {
                                show: true //Heat map displays numerical values
                            },
                            emphasis: { //Highlight when hovering the mouse over the heatmap block
                                itemStyle: {
                                    shadowBlur: 10,
                                    shadowColor: 'rgba(0, 0, 0, 0.5)'
                                }
                            }
                        }
                    ]
                };
                myCharts.setOption(option)
            }
            getJsonData(jsonFiles[0])
        </script>
    </body>

</html>
The web page is shown below:

You can click “SaveAsImage” in the upper right corner to save the image to the desktop.