Reference: Implementation steps of MATLAB panoramic cutting and box plot display | w3cschool notes
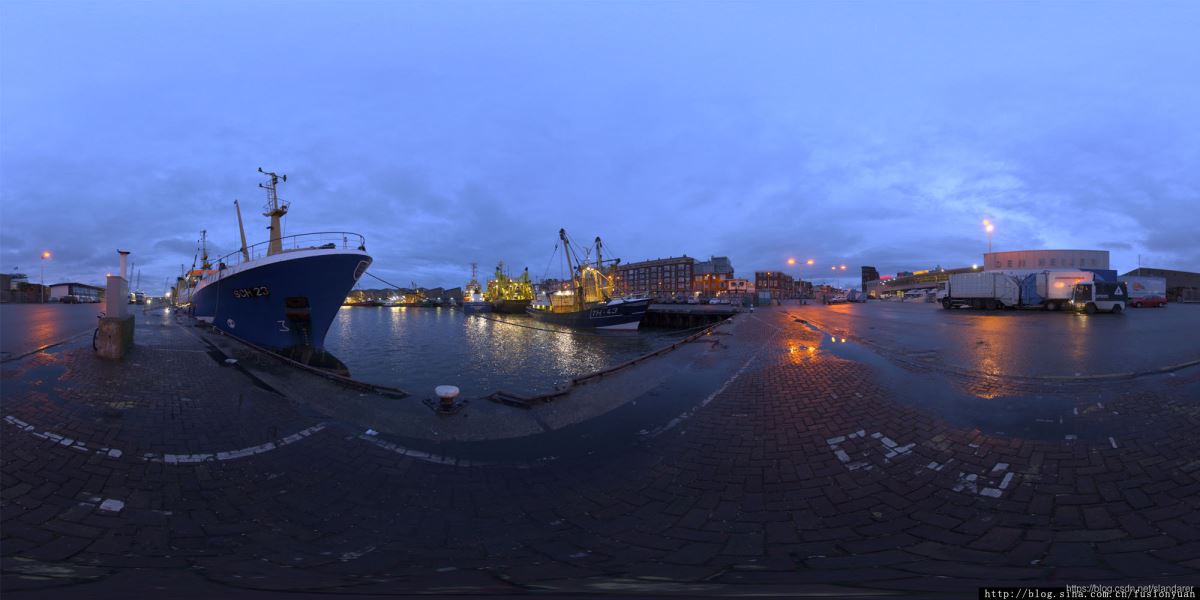
In the field of photography, panorama is a photography technology that can capture all the surrounding 360-degree scenes, but the actual look and feel of panorama is not that good (see the example of panorama below). We can use matlab to cut the panorama and then convert it into a box plot to display it.
part1 panorama cutting
Original image:

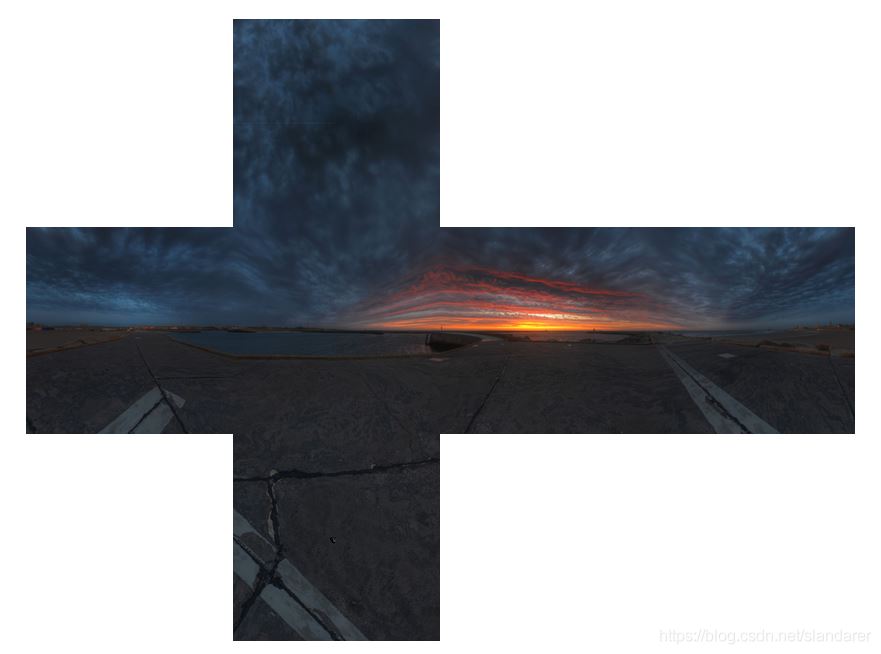
Cutting effect:
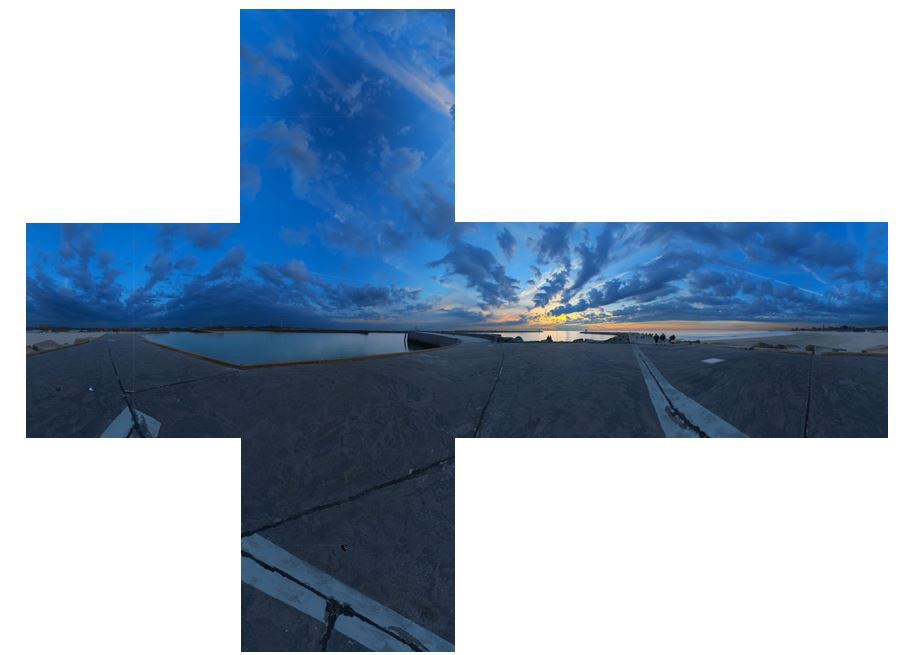
The following are some steps for cutting:
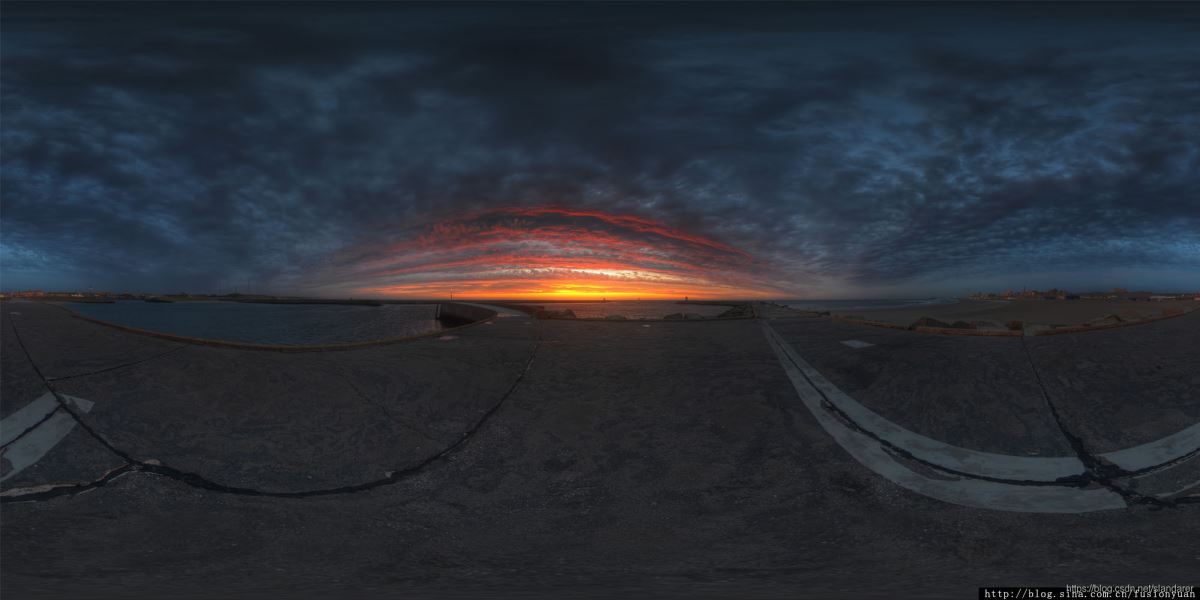
Take this picture as an example. The picture format can be hdr, jpg or whatever:

1.1 Edge culling
Some panoramas will have white and gray edges. If they are cut directly, the following effect will appear:

At this time, we first need to remove the white edges of the original image. The code is as follows:
oriPic=imread('test.hdr');
[rows,cols,~]=size(oriPic);

for i=cols:-1:1
    tempListR=oriPic(floor(rows/4):ceil(3*rows/4),i,1);
    tempListG=oriPic(floor(rows/4):ceil(3*rows/4),i,1);
    tempListB=oriPic(floor(rows/4):ceil(3*rows/4),i,1);
    if all(round(tempListR-mean(tempListR))==0) & amp; & amp;all(tempListR==tempListG) & amp; & amp;all(tempListR==tempListB)
        oriPic(:,i,:)=[];
    else
        break;
    end
end
oriPic=oriPic(:,end:-1:1,:);
for i=size(oriPic,2):-1:1
    tempListR=oriPic(floor(rows/4):ceil(3*rows/4),i,1);
    tempListG=oriPic(floor(rows/4):ceil(3*rows/4),i,1);
    tempListB=oriPic(floor(rows/4):ceil(3*rows/4),i,1);
    if all(round(tempListR-mean(tempListR))==0) & amp; & amp;all(tempListR==tempListG) & amp; & amp;all(tempListR==tempListB)
        oriPic(:,i,:)=[];
    else
        break;
    end
end
oriPic=oriPic(:,end:-1:1,:);
for i=rows:-1:1
    tempListR=oriPic(i,floor(cols/4):ceil(3*cols/4),1);
    tempListG=oriPic(i,floor(cols/4):ceil(3*cols/4),1);
    tempListB=oriPic(i,floor(cols/4):ceil(3*cols/4),1);
    if all(round(tempListR-mean(tempListR))==0) & amp; & amp;all(tempListR==tempListG) & amp; & amp;all(tempListR==tempListB)
        oriPic(i,:,:)=[];
    else
        break;
    end
end
oriPic=oriPic(end:-1:1,:,:);
for i=size(oriPic,1):-1:1
    tempListR=oriPic(i,floor(cols/4):ceil(3*cols/4),1);
    tempListG=oriPic(i,floor(cols/4):ceil(3*cols/4),1);
    tempListB=oriPic(i,floor(cols/4):ceil(3*cols/4),1);
    if all(round(tempListR-mean(tempListR))==0) & amp; & amp;all(tempListR==tempListG) & amp; & amp;all(tempListR==tempListB)
        oriPic(i,:,:)=[];
    else
        break;
    end
end
oriPic=oriPic(end:-1:1,:,:);
1.2 Image cropping
What we want to accomplish is the following transformation and cropping:

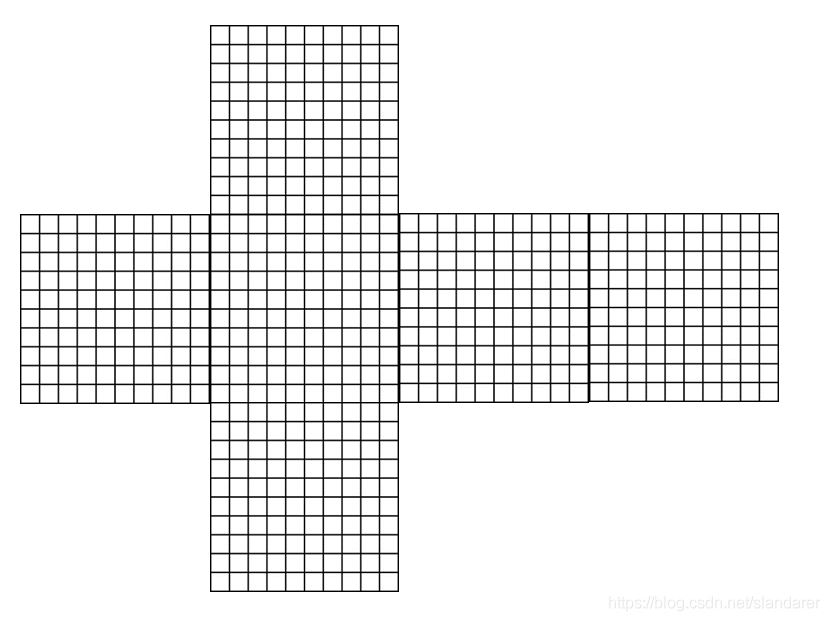
This part actually already has relatively mature principles and codes:
Code reference:https://stackoverflow.com/questions/29678510/convert-21-equirectangular-panorama-to-cube-map
Principle Reference:
http://paulbourke.net/panorama/cubemaps/#1
http://paulbourke.net/panorama/cubemaps/
Please refer to the clearer change diagram in the principle reference article:
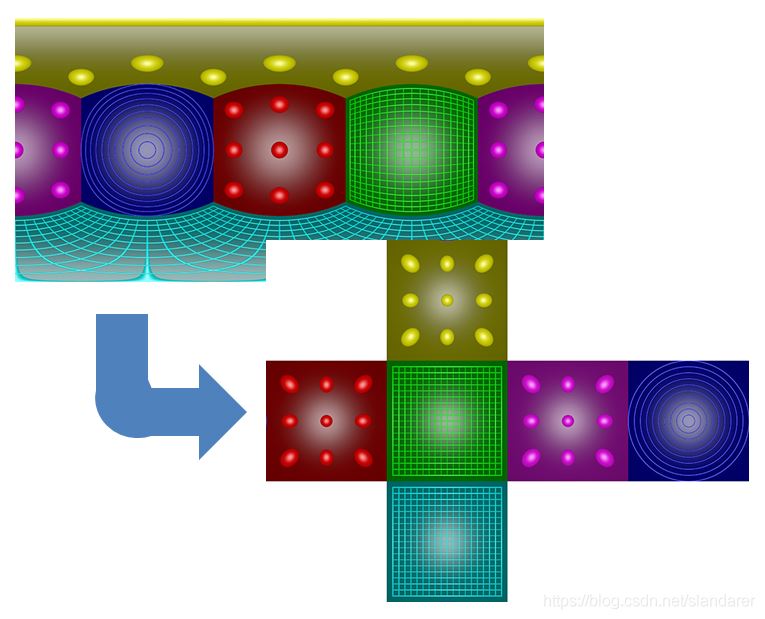
Another:
Based on the reference code, the mapped pixels are interpolated to make the image smoother. The principle is as follows:


Main function code:
function resultPic=createCubeMapFace(oriPic,id,height,width)
    [M,N,~]=size(oriPic);
    resultPic=zeros([height,width,3]);
    an=sin(pi/4);
    ak=cos(pi/4);

    faceTransform=[0,0;
               pi/2,0;
               pi,0;
               -pi/2,0;
               0,-pi/2;
               0,pi];
    ftu=faceTransform(id,1);
    ftv=faceTransform(id,2);

    for y=0:height-1
        for x=0:width-1
            nx=y/height-0.5;
            ny=x/width-0.5;

            nx=nx*2*an;
            ny=ny*2*an;

            if (ftv == 0)
                u=atan2(nx, ak);
                v=atan2(ny*cos(u),ak);
                u=u + ftu;
            elseif(ftv>0)
                d=sqrt(nx*nx + ny*ny);
                v=pi/2-atan2(d,ak);
                u=atan2(ny,nx);
            else
                d=sqrt(nx*nx + ny*ny);
                v=-pi/2 + atan2(d,ak);
                u=atan2(-ny,nx);
            end

            u=u/(pi);
            v=v/(pi/2);

            while(v<-1)
                v=v + 2;
                u=u + 1;
            end
            while(v>1)
                v=v-2;
                u=u + 1;
            end
            while(u<-1)
                u=u + 2;
            end
            while(u>1)
                u=u-2;
            end
            u=u/2 + 0.5;
            v=v/2 + 0.5;

            u=u*(N-1) + 1;
            v=v*(M-1) + 1;

            fv=floor(v);fv1=floor(v) + 1;pv=v-fv;fv1(fv1>M)=M;
            fu=floor(u);fu1=floor(u) + 1;pu=u-fu;fu1(fu1>N)=N;
            resultPic(x + 1,y + 1,:)=double(oriPic(fv,fu,:)).*(1-pv).*(1-pu) + ...
                                 double(oriPic(fv1,fu,:)).*(pv).*(1-pu) + ...
                                 double(oriPic(fv,fu1,:)).*(1-pv).*(pu) + ...
                                 double(oriPic(fv1,fu1,:)).*(pv).*(pu);
        end
    end
    resultPic=uint8(resultPic);
end
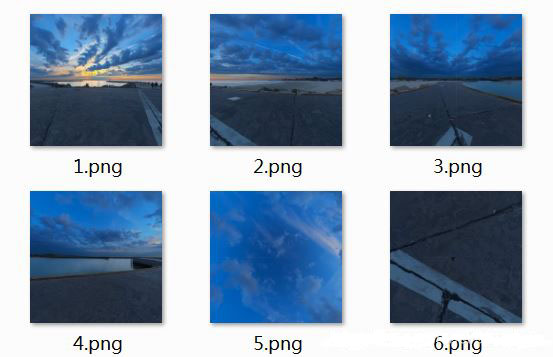
Function call and image storage:
The length and width values here can be set arbitrarily, but the length and width values must be consistent. If you follow the current writing method, the results will be stored in the result folder:
if ~exist('result','dir')
   mkdir('result');
end

for i=1:6
    resultPic=createCubeMapFace(oriPic,i,500,500);
    figure(i)
    imshow(resultPic)
    imwrite(resultPic,['result',num2str(i),'.jpg'])
end
Another: As shown in the picture
Picture numbers [1,2,3,4,5,6] respectively correspond to pictures [right, back, left, front, top, bottom]

1.3 complete code
function panoramic2box
oriPic=imread('889027-884424860.jpg');
[rows,cols,~]=size(oriPic);

for i=cols:-1:1
    tempListR=oriPic(floor(rows/4):ceil(3*rows/4),i,1);
    tempListG=oriPic(floor(rows/4):ceil(3*rows/4),i,1);
    tempListB=oriPic(floor(rows/4):ceil(3*rows/4),i,1);
    if all(round(tempListR-mean(tempListR))==0) & amp; & amp;all(tempListR==tempListG) & amp; & amp;all(tempListR==tempListB)
        oriPic(:,i,:)=[];
    else
        break;
    end
end
oriPic=oriPic(:,end:-1:1,:);
for i=size(oriPic,2):-1:1
    tempListR=oriPic(floor(rows/4):ceil(3*rows/4),i,1);
    tempListG=oriPic(floor(rows/4):ceil(3*rows/4),i,1);
    tempListB=oriPic(floor(rows/4):ceil(3*rows/4),i,1);
    if all(round(tempListR-mean(tempListR))==0) & amp; & amp;all(tempListR==tempListG) & amp; & amp;all(tempListR==tempListB)
        oriPic(:,i,:)=[];
    else
        break;
    end
end
oriPic=oriPic(:,end:-1:1,:);
for i=rows:-1:1
    tempListR=oriPic(i,floor(cols/4):ceil(3*cols/4),1);
    tempListG=oriPic(i,floor(cols/4):ceil(3*cols/4),1);
    tempListB=oriPic(i,floor(cols/4):ceil(3*cols/4),1);
    if all(round(tempListR-mean(tempListR))==0) & amp; & amp;all(tempListR==tempListG) & amp; & amp;all(tempListR==tempListB)
        oriPic(i,:,:)=[];
    else
        break;
    end
end
oriPic=oriPic(end:-1:1,:,:);
for i=size(oriPic,1):-1:1
    tempListR=oriPic(i,floor(cols/4):ceil(3*cols/4),1);
    tempListG=oriPic(i,floor(cols/4):ceil(3*cols/4),1);
    tempListB=oriPic(i,floor(cols/4):ceil(3*cols/4),1);
    if all(round(tempListR-mean(tempListR))==0) & amp; & amp;all(tempListR==tempListG) & amp; & amp;all(tempListR==tempListB)
        oriPic(i,:,:)=[];
    else
        break;
    end
end
oriPic=oriPic(end:-1:1,:,:);
% ================================================= ========================
if ~exist('result','dir')
   mkdir('result');
end

for i=1:6
    resultPic=createCubeMapFace(oriPic,i,500,500);
    figure(i)
    imshow(resultPic)
    imwrite(resultPic,['result',num2str(i),'.jpg'])
end


% ================================================= ========================
function resultPic=createCubeMapFace(oriPic,id,height,width)
    [M,N,~]=size(oriPic);
    resultPic=zeros([height,width,3]);
    an=sin(pi/4);
    ak=cos(pi/4);

    faceTransform=[0,0;
               pi/2,0;
               pi,0;
               -pi/2,0;
               0,-pi/2;
               0,pi];
    ftu=faceTransform(id,1);
    ftv=faceTransform(id,2);

    for y=0:height-1
        for x=0:width-1
            nx=y/height-0.5;
            ny=x/width-0.5;

            nx=nx*2*an;
            ny=ny*2*an;

            if (ftv == 0)
                u=atan2(nx, ak);
                v=atan2(ny*cos(u),ak);
                u=u + ftu;
            elseif(ftv>0)
                d=sqrt(nx*nx + ny*ny);
                v=pi/2-atan2(d,ak);
                u=atan2(ny,nx);
            else
                d=sqrt(nx*nx + ny*ny);
                v=-pi/2 + atan2(d,ak);
                u=atan2(-ny,nx);
            end

            u=u/(pi);
            v=v/(pi/2);

            while(v<-1)
                v=v + 2;
                u=u + 1;
            end
            while(v>1)
                v=v-2;
                u=u + 1;
            end
            while(u<-1)
                u=u + 2;
            end
            while(u>1)
                u=u-2;
            end
            u=u/2 + 0.5;
            v=v/2 + 0.5;

            u=u*(N-1) + 1;
            v=v*(M-1) + 1;

            fv=floor(v);fv1=floor(v) + 1;pv=v-fv;fv1(fv1>M)=M;
            fu=floor(u);fu1=floor(u) + 1;pu=u-fu;fu1(fu1>N)=N;
            resultPic(x + 1,y + 1,:)=double(oriPic(fv,fu,:)).*(1-pv).*(1-pu) + ...
                                 double(oriPic(fv1,fu,:)).*(pv).*(1-pu) + ...
                                 double(oriPic(fv,fu1,:)).*(1-pv).*(pu) + ...
                                 double(oriPic(fv1,fu1,:)).*(pv).*(pu);
        end
    end
    resultPic=uint8(resultPic);
end
end
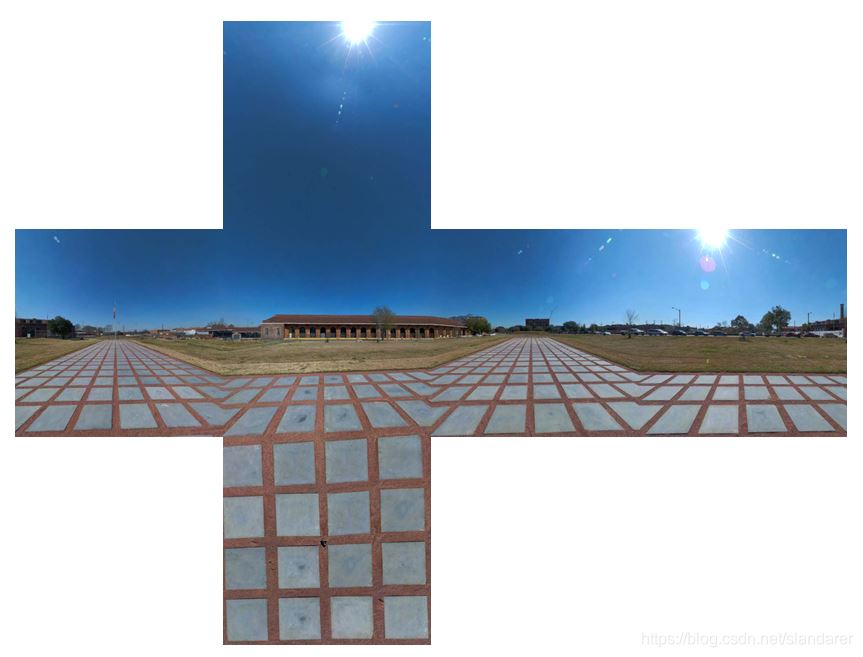
1.4 Other sets of cutting results
Picture source: https://www.cgmodel.com/article/9004.html


part2 box diagram display
2.1 Surface drawing
After using surf to draw each surface, and map each surface:
for i=1:6
    oriPic.(['p',num2str(i)])=imread(['result',num2str(i),'.jpg']);
end
[rows,cols,~]=size(oriPic.p1);
[baseXY,baseZ]=meshgrid(1:cols,rows:-1:1);

ax=gca;hold(ax,'on')


surf(baseXY(:,end:-1:1)-(1 + rows)/2,-(rows-1)./2.*ones(size(baseXY)),baseZ,'CData',oriPic.p1 ,'EdgeColor','none','FaceColor','interp')
surf(-(rows-1)./2.*ones(size(baseXY)),baseXY-(1 + rows)/2,baseZ,'CData',oriPic.p2,'EdgeColor','none',' FaceColor','interp')
surf(baseXY-(1 + rows)/2,(rows-1)./2.*ones(size(baseXY)),baseZ,'CData',oriPic.p3,'EdgeColor','none','FaceColor ','interp')
surf((rows-1)./2.*ones(size(baseXY)),baseXY(:,end:-1:1)-(1 + rows)/2,baseZ,'CData',oriPic.p4, 'EdgeColor','none','FaceColor','interp')
surf(baseXY'-(1 + rows)/2,baseXY-(1 + rows)/2,ones(size(baseXY)),'CData',oriPic.p6(end:-1:1,end:-1 :1,:),'EdgeColor','none','FaceColor','interp')
surf(baseXY'-(1 + rows)/2,baseXY-(1 + rows)/2,rows-1 + ones(size(baseXY)),'CData',oriPic.p5(:,end:-1: 1,:),'EdgeColor','none','FaceColor','interp')

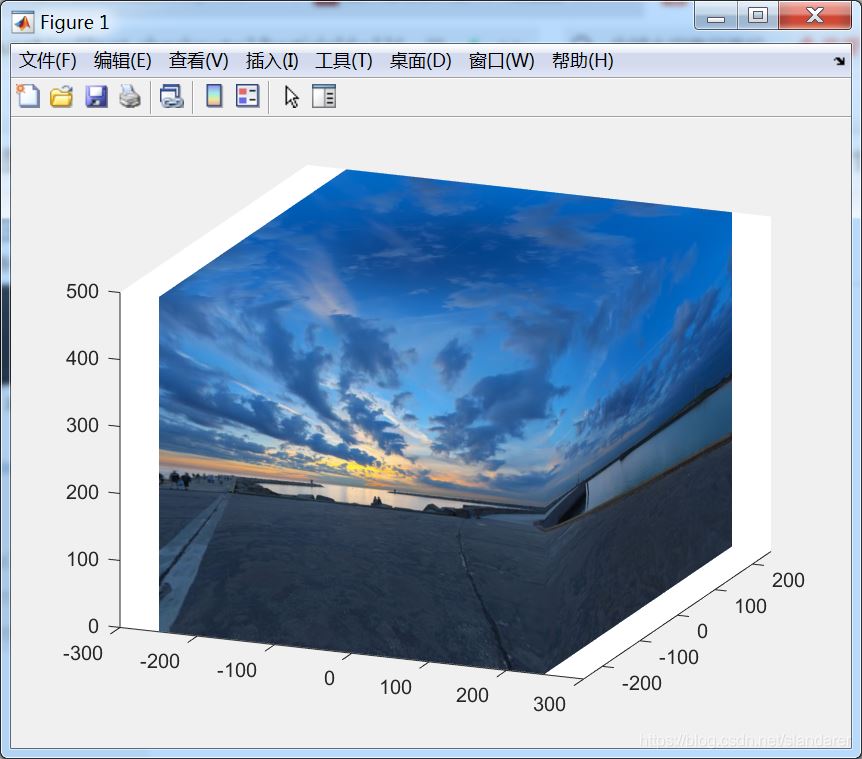
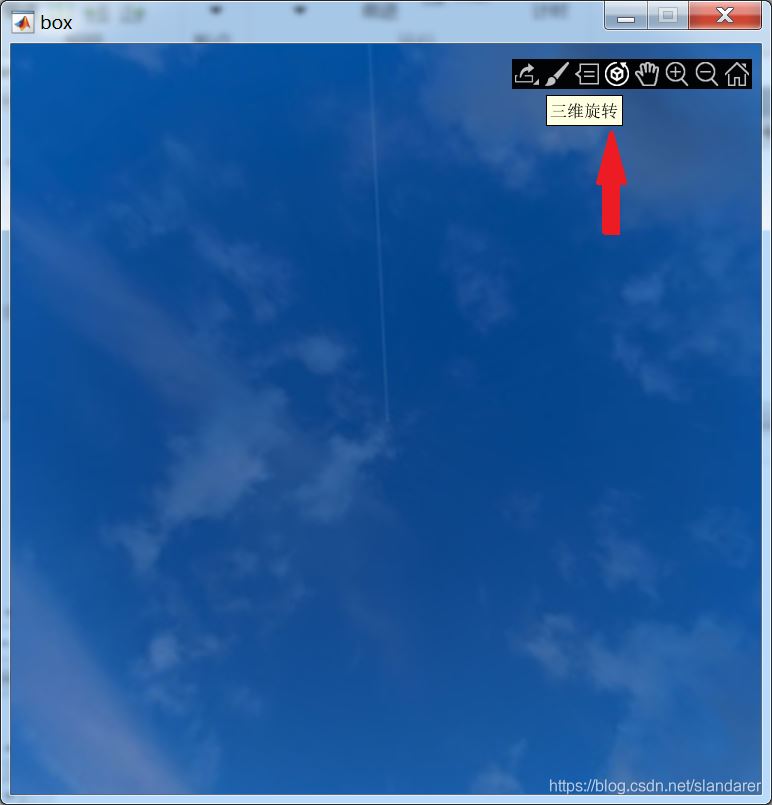
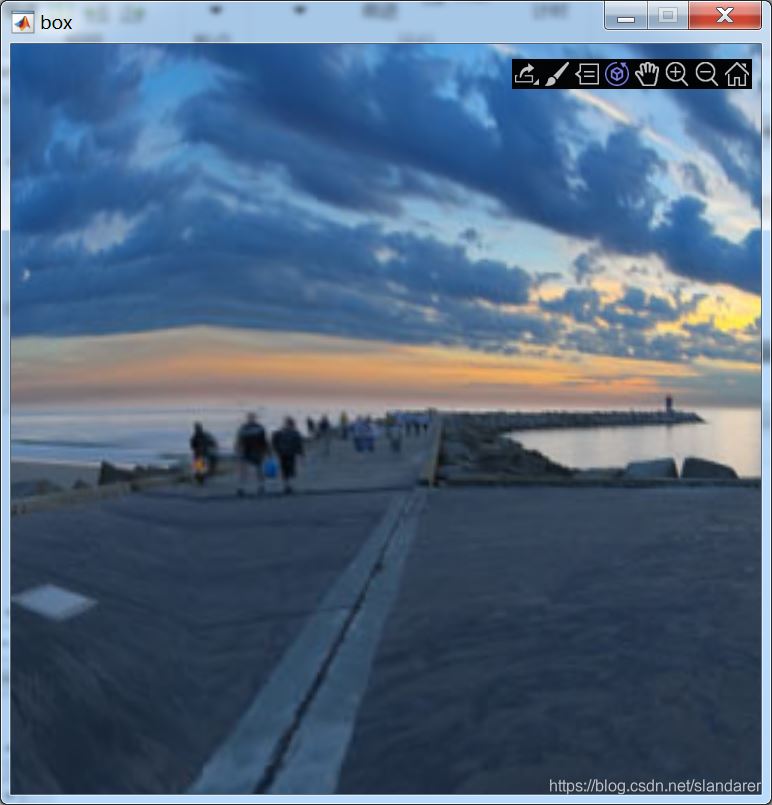
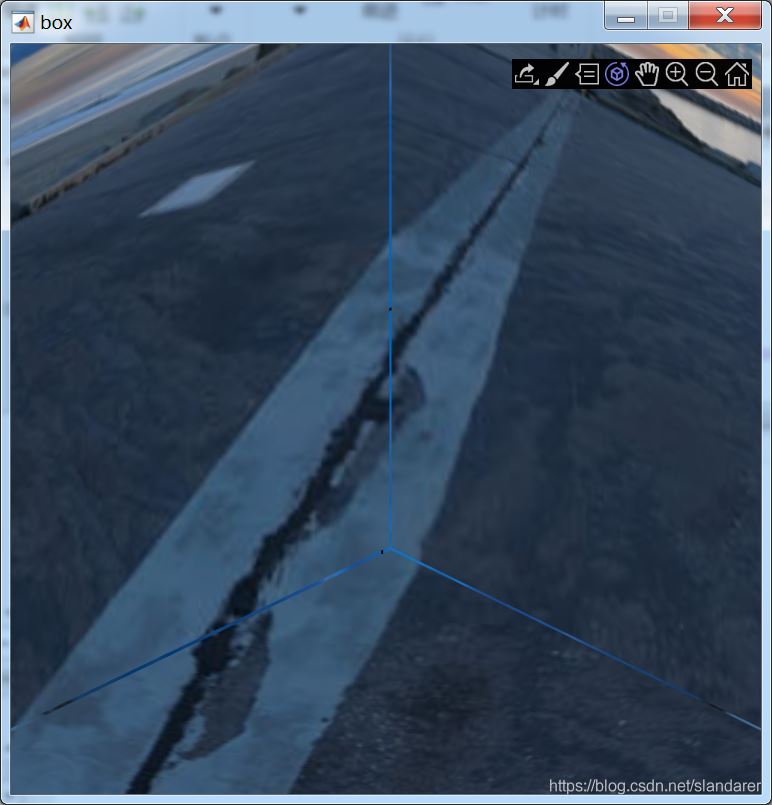
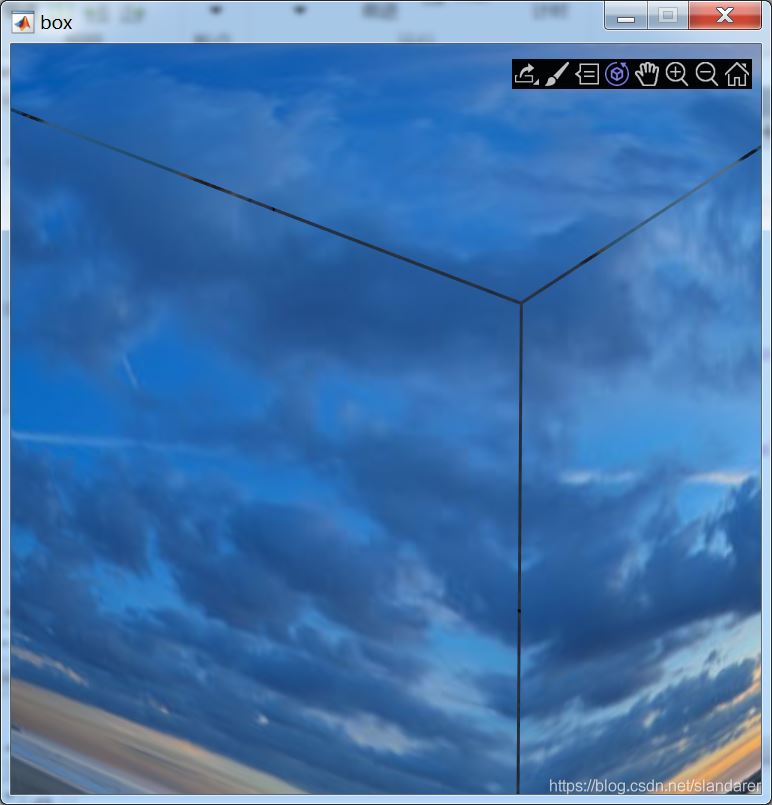
2.2 Viewing angle adjustment
Adjust the perspective to inside the box by setting the axes attribute
ax=axes('parent',fig,'position',[-0.45 -0.45 1.9 1.9]);hold(ax,'on')
ax.ZLim=[0,rows + 1];
ax.XLim=[0-(1 + rows)/2,rows + 1-(1 + rows)/2];
ax.YLim=[0-(1 + rows)/2,rows + 1-(1 + rows)/2];
ax.Color=[0 0 0];
ax.CameraPosition=[0,0,rows/2];
ax.CameraPositionMode='manual';
ax.DataAspectRatio=[1,1,1];
ax.DataAspectRatioMode='manual';
ax.Projection='perspective';
ax.CameraTargetMode='manual';
ax.CameraViewAngle = 7;
ax.View=[-2.7391 90.0000];
ax.CameraTarget=[0 0 (rows-1)/2];
ax.Toolbar.Visible='on';
After running, click the three-digit rotating button to start roaming
The box image at this time is the seamless version, and the gapped version is placed at the back.

2.3 Complete code
Seamless version:
function showBox
for i=1:6
    oriPic.(['p',num2str(i)])=imread(['result',num2str(i),'.jpg']);
end
[rows,cols,~]=size(oriPic.p1);
[baseXY,baseZ]=meshgrid(1:cols,rows:-1:1);

fig=figure('units','pixels','position',[300 80 500 500],...
                       'Numbertitle','off','menubar','none','resize','off',...
                       'name','box');


ax=axes('parent',fig,'position',[-0.45 -0.45 1.9 1.9]);hold(ax,'on')
ax.ZLim=[0,rows + 1];
ax.XLim=[0-(1 + rows)/2,rows + 1-(1 + rows)/2];
ax.YLim=[0-(1 + rows)/2,rows + 1-(1 + rows)/2];
ax.Color=[0 0 0];
ax.CameraPosition=[0,0,rows/2];
ax.CameraPositionMode='manual';
ax.DataAspectRatio=[1,1,1];
ax.DataAspectRatioMode='manual';
ax.Projection='perspective';
ax.CameraTargetMode='manual';
ax.CameraViewAngle = 7;
ax.View=[-2.7391 90.0000];
ax.CameraTarget=[0 0 (rows-1)/2];
ax.Toolbar.Visible='on';


surf(baseXY(:,end:-1:1)-(1 + rows)/2,-(rows-1)./2.*ones(size(baseXY)),baseZ,'CData',oriPic.p1 ,'EdgeColor','none','FaceColor','interp')
surf(-(rows-1)./2.*ones(size(baseXY)),baseXY-(1 + rows)/2,baseZ,'CData',oriPic.p2,'EdgeColor','none',' FaceColor','interp')
surf(baseXY-(1 + rows)/2,(rows-1)./2.*ones(size(baseXY)),baseZ,'CData',oriPic.p3,'EdgeColor','none','FaceColor ','interp')
surf((rows-1)./2.*ones(size(baseXY)),baseXY(:,end:-1:1)-(1 + rows)/2,baseZ,'CData',oriPic.p4, 'EdgeColor','none','FaceColor','interp')
surf(baseXY'-(1 + rows)/2,baseXY-(1 + rows)/2,ones(size(baseXY)),'CData',oriPic.p6(end:-1:1,end:-1 :1,:),'EdgeColor','none','FaceColor','interp')
surf(baseXY'-(1 + rows)/2,baseXY-(1 + rows)/2,rows-1 + ones(size(baseXY)),'CData',oriPic.p5(:,end:-1: 1,:),'EdgeColor','none','FaceColor','interp')

end
Gap version:
function showBox2
for i=1:6
    oriPic.(['p',num2str(i)])=imread(['result',num2str(i),'.jpg']);
end
[rows,cols,~]=size(oriPic.p1);
[baseXY,baseZ]=meshgrid(1:cols,rows:-1:1);

fig=figure('units','pixels','position',[300 80 500 500],...
                       'Numbertitle','off','menubar','none','resize','off',...
                       'name','box');


ax=axes('parent',fig,'position',[-0.45 -0.45 1.9 1.9]);hold(ax,'on')
ax.ZLim=[0,rows + 1];
ax.XLim=[0-(1 + rows)/2,rows + 1-(1 + rows)/2];
ax.YLim=[0-(1 + rows)/2,rows + 1-(1 + rows)/2];
ax.Color=[0 0 0];
ax.CameraPosition=[0,0,rows/2];
ax.CameraPositionMode='manual';
ax.DataAspectRatio=[1,1,1];
ax.DataAspectRatioMode='manual';
ax.Projection='perspective';
ax.CameraTargetMode='manual';
ax.CameraViewAngle = 7;
ax.View=[-2.7391 90.0000];
ax.CameraTarget=[0 0 (rows + 1)/2];
ax.Toolbar.Visible='on';


surf(baseXY(:,end:-1:1)-rows/2,-rows./2.*ones(size(baseXY)),baseZ,'CData',oriPic.p1,'EdgeColor','none' ,'FaceColor','interp')
surf(-rows./2.*ones(size(baseXY)),baseXY-(1 + rows)/2,baseZ,'CData',oriPic.p2,'EdgeColor','none','FaceColor',' interp')
surf(baseXY-(1 + rows)/2,rows./2.*ones(size(baseXY)),baseZ,'CData',oriPic.p3,'EdgeColor','none','FaceColor','interp ')
surf(rows./2.*ones(size(baseXY)),baseXY(:,end:-1:1)-(1 + rows)/2,baseZ,'CData',oriPic.p4,'EdgeColor', 'none','FaceColor','interp')
surf(baseXY'-(1 + rows)/2,baseXY-(1 + rows)/2,zeros(size(baseXY)),'CData',oriPic.p6(end:-1:1,end:-1 :1,:),'EdgeColor','none','FaceColor','interp')
surf(baseXY'-(1 + rows)/2,baseXY-(1 + rows)/2,rows + ones(size(baseXY)),'CData',oriPic.p5(:,end:-1:1, :),'EdgeColor','none','FaceColor','interp')

end
The above are the details of panoramic cutting and box plot display in MATLAB
The knowledge points of the article match the official knowledge files, and you can further learn related knowledge. Algorithm skill tree Home page Overview 57524 people are learning the system