Big factory technology advanced front-end Node advanced
Click above for Programmer Growth Guide and follow the official account
Reply 1, join the advanced Node communication group
Author:NewName
https://juejin.cn/post/7273072756156235834
I recently read an article on front-end performance optimization. I had never done any performance optimization before, so I just studied it. If you want to optimize performance, you need to know what performance-related indicators there are, what tools are available to quantitatively evaluate the performance of the website, how to optimize, and what the optimization ideas are. After learning a lot, I decided to use Lighthouse, a performance testing tool, to evaluate the performance of the website I developed. It scored 56 before optimization and 96 after optimization. How did you do it? Read this article and learn together~

1. Use of Lighthouse
Lighthouse is an open source web performance testing tool developed by Google. It provides guidance and suggestions for development to optimize user experience and website performance by monitoring and testing all aspects of website application performance.
Here are two ways to use Lighthouse: through the Chrome plug-in and through the Node CLI.
1.1 Use via Chrome plug-in
First, now is the Lighthouse plug-in (Lighthouse Google Chrome plug-in download address: https://chrome.google.com/webstore/detail/lighthouse/blipmdconlkpinefehnmjammfjpmpbjk/related.
Then open the Chrome Developer Tools, click the [three dots] in the upper right corner, click [More Tools], and then click [Performance Monitor]:

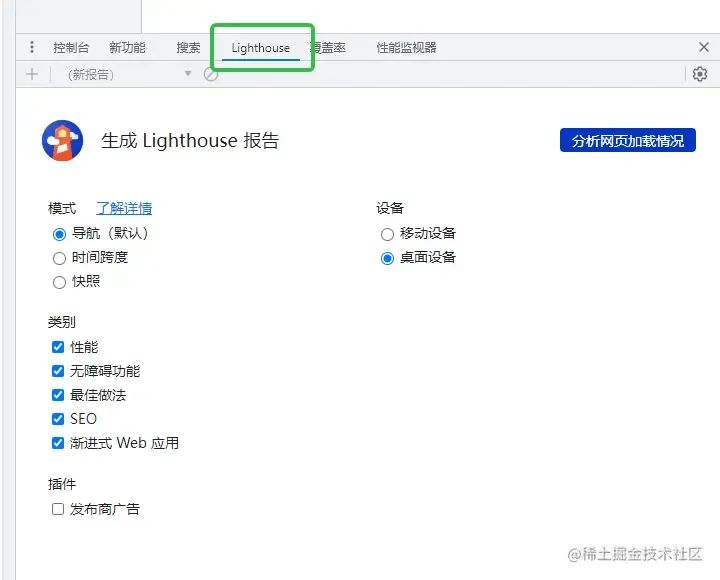
Then click the [Lighthouse] tab and click the [Analyze web page loading] button:
The following is the score of the page being pinched:
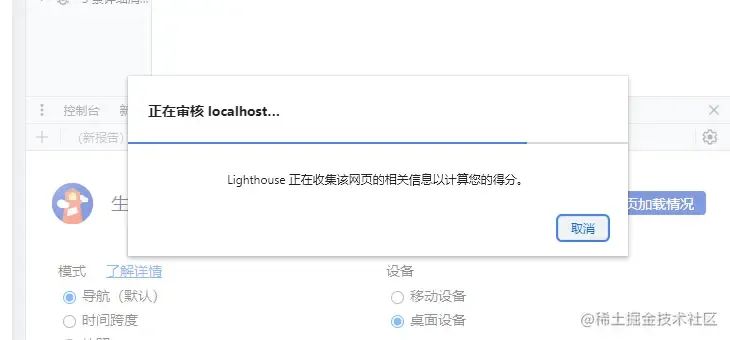
After a few seconds, Lighthouse performance analysis error generated:
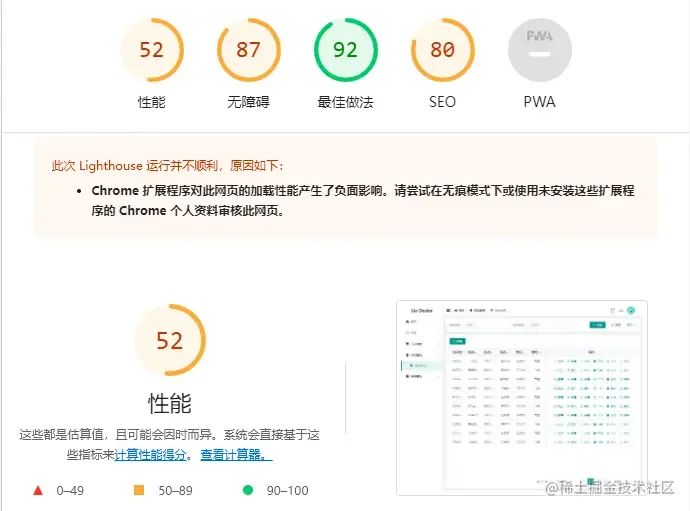
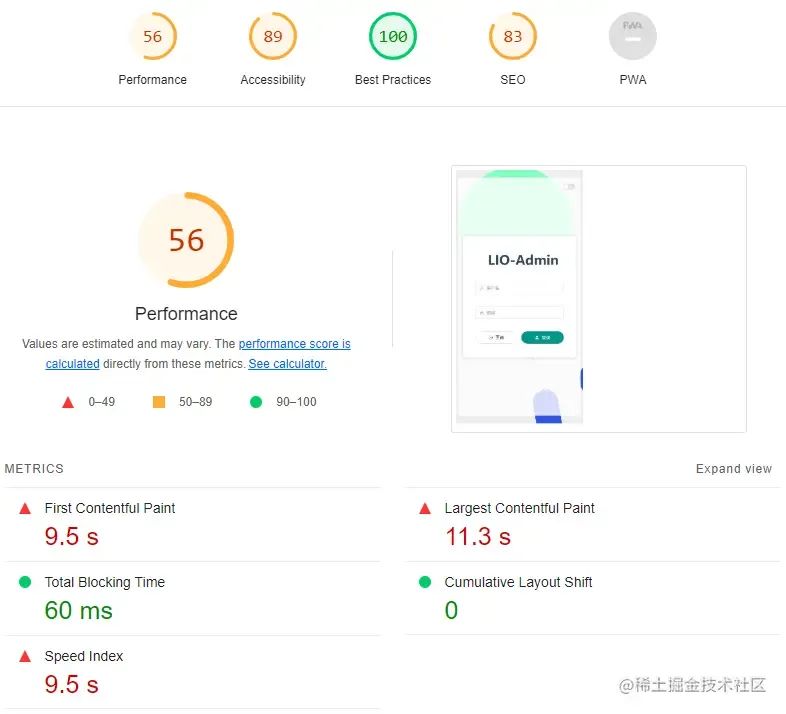
It can be seen that the performance score is relatively low, and the specific index scores are as follows:
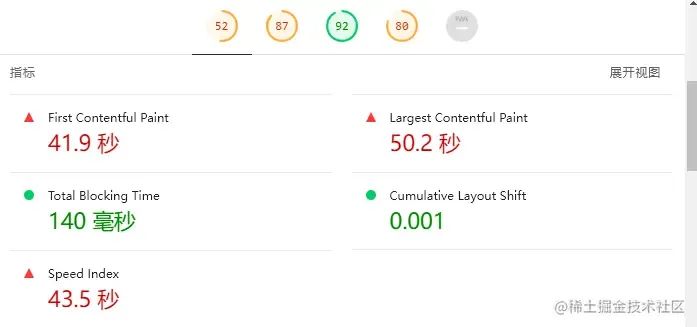
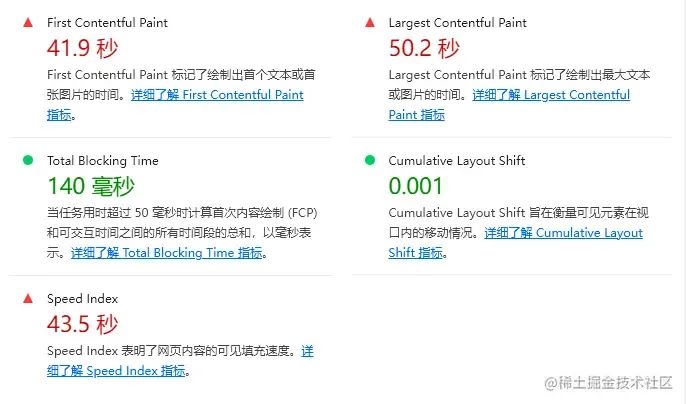
Click [Expand View] to understand the meaning of each indicator. You can click on the link to learn the details of each indicator and specific optimization strategies:
Further down you can view optimization suggestions:

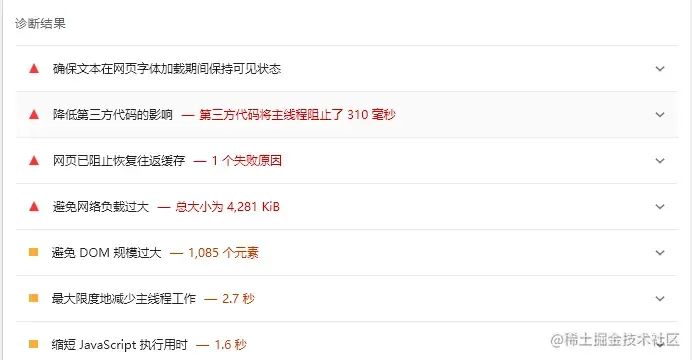
Further down you can see the diagnosis results:
1.2 Using Node CLI
Currently, Lighthouse has released an npm package that can be integrated into the project: npm i lighthouse
The following is the script code:
const run = async () => {
const browser = await puppeteer.launch({
headless: "new",
args: ["--no-sandbox", "--disable-setuid-sandbox"],
});
const page = await browser.newPage();
const url = "your webpage url";
await page.goto(url);
const { port } = new URL(browser.wsEndpoint());
const { report } = await lighthouse(url, {
port,
output: "html",
});
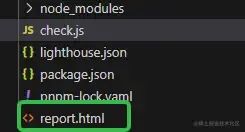
await writeFile("report.html", report);
await browser.close();
};
run();
Run the script to get the analysis report generated by Lighthouse:
The content of the analysis report is the same as that obtained through the browser plug-in, but it is in English. It can be improved and enriched on this basis in the future, and the deployment process of front-end engineering can be optimized.
With the performance analysis report, we can optimize the project based on each performance indicator score, optimization suggestions and diagnosis results. Let’s learn more about these performance optimization indicators in detail.
2. Performance optimization indicators
2.1 FCP (First Contentful Paint) first content painting

2.1.1 Definition
First content draw time, which measures the time from when a page starts loading until any part of the page’s content has finished rendering on the screen.
2.1.2 Understanding of definitions
The page content must be text, pictures (including background images), non-white canvas or SVG.
This is the first time the user sees the content of the page. Note that this is part of the content, not all of it.
As you can see in the image below, FCP occurs on the second frame because that’s when the first text and image elements have finished rendering on the screen:

As you can see in the image above, while some content has finished rendering, not all content has finished rendering. This is an important difference between First Content Paint Time (FCP) and Largest Contentful Paint Time (LCP).
2.1.3 Evaluation Criteria

The FCP time is 0-1.8 seconds, which means good, the color is green, and the FCP score will be 75~100 points;
The FCP time is 1.9-3.0 seconds, indicating the need for improvement, the color is orange, and the FCP score will be between 50 and 74 points;
If the FCP time is more than 3.1 seconds, it indicates poor progress, the color is red, and the FCP score will be between 0 and 49 points.
2.1.4 Methods to shorten FCP time
For guidance, please refer to: How to improve FCP [1]. See below for how to do this in this article.
2.1.5 Notes
This indicator is of little significance for web projects that do not use SSR technology, because the first drawing occurs when the JS is usually not loaded.
2.2 LCP (Largest Contentful Pain) maximum content rendering

2.2.1 Definition
Maximum content drawing time, based on the time when the page first starts loading, calculates the relative time for the largest image or text block visible in the visible area to complete rendering.
2.2.2 Understanding of definitions
Elements to be considered by LCP include: img elements and img elements embedded within svg elements, video elements, background image elements loaded through url(), and block-level elements containing text nodes or other inline-level text elements.
As shown in the figure below, the maximum element changes as content loads, as new content is added to the DOM, and therefore the maximum element changes:

2.2.3 Evaluation Criteria

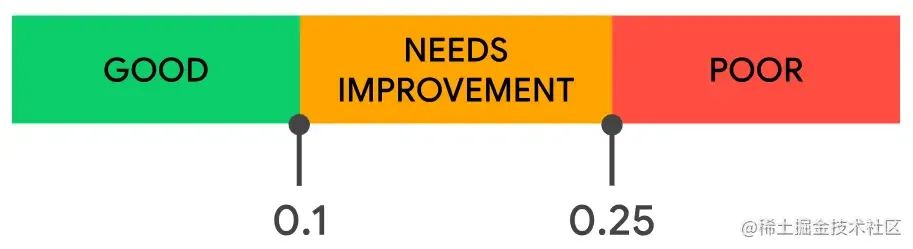
The LCP time is 0-2.5 seconds, indicating good condition and the color is green;
The LCP time is 2.6-4.0 seconds, indicating that improvement is needed and the color is orange;
If the LCP time is more than 4.1 seconds, it indicates poor progress and the color is red.
2.2.4 Methods to shorten LCP time
For guidance, please refer to: How to improve LCP[2]. See below for how to do this in this article.
2.2.5 Notes
In some cases, the most important element (or elements) on the page is not the largest element, and the developer may be more interested in measuring the rendering time of the former (using the Element Timing API[3] ).
2.3 TBT (Total Blocking Time) total blocking time
2.3.1 Definition
The Total Blocking Time (TBT) metric measures the total time between First Contentful Paint (FCP) and Time to Interactive (TTI).
2.3.2 Understanding of definitions
It can be seen from the definition: TBT involves the two concepts of FCP and TTI. FCP has been introduced above. Here is a supplement to TTI (definition of interactive time): The TTI indicator measurement page is loaded from the beginning to the main sub-resource to complete rendering, and The time required to respond to user input quickly and reliably.
2.3.3 Evaluation Criteria
The evaluation criteria are included in the table below:

TBT scoring criteria[4]
In order to provide a good user experience, websites should strive to control TBT within 300 milliseconds when tested on ordinary mobile hardware.
2.3.4 Methods to shorten TBT
For guidance, please refer to: How to improve TBT[5]. See below for how to do this in this article.
2.4 CLS (Cumulative Layout Shift) cumulative layout offset

2.4.1 Definition
CLS measures the largest sequence of layout shift fractions among all unexpected layout shifts that occur throughout the page’s lifetime.
2.4.2 Understanding of definitions
Cumulative Layout Shift (CLS) is an important user-centric metric for measuring visual stability because it helps quantify how often users experience unexpected layout shifts. Lower CLS helps ensure that a page is pleasant.
2.4.3 Evaluation Criteria
2.4.4 Methods to shorten CLS
For guidance, please refer to: How to improve CLS[6], which is not covered in this article.
2.5 SI (Speed Index) speed indicator
2.5.1 Definition
SI is an indicator of how quickly content fills the visible area of the page.
2.5.2 Understanding of definitions
This metric captures the time at which a pixel appears on the page.
2.5.3 Evaluation Criteria
The evaluation criteria are included in the table below:

2.5.5 Methods to shorten SI
For guidance, please refer to: How to improve SI[7]. See below for how to do this in this article.
3. Specific performance optimization methods
Document Fast Loading summarizes some techniques for improving website performance and lists the common methods:
1. Eliminate rendering-blocking resources: For example, add async or defer to third-party script tags.
2. Minify CSS and remove unused CSS: For example, use a compressor to compress CSS.
3. Preconnect to the required resources: For example, use to notify the browser that the page intends to establish a connection with another source, and hopes that the process will start as soon as possible.
4. Reduce server response time: for example, use HTTP2.
5. Use cache: For example, use HTTP cache.
6. Optimize images: such as compressing images, using CDN, lazy loading, etc.
7. Delete unused code: For example, delete unused libraries, delete unnecessary libraries, delete useless code, and introduce component libraries as needed.
8. Reduce JS load: such as dynamic import and code splitting.
The following is an introduction to the methods I use based on my projects:
3.1 Using vite-compression-plugin
You can use vite-compression-plugin[8] to gizp compress the code. The usage method is as follows:
vite.config.ts:
import viteCompression from 'vite-plugin-compression'
export default defineConfig({
  plugins:[
    viteCompression({
      ext: ".gz",
      algorithm: "gzip",
      deleteOriginFile: false
    })
  ]
})
For the specific configuration of the plug-in, you can check the plug-in documentation and choose the appropriate compression algorithm.
3.2 Turn on gizp compression of ngnix
There is a .devops directory under the author’s front-end project, and there is an ngnix.conf file below to configure ngnix of this front-end project separately:

The configuration method is to add the following configuration under the server:
server {
  gzip on;
  gzip_buffers 32 4K;
  gzip_comp_level 6;
  gzip_min_length 100;
  gzip_types application/javascript text/plain text/css text/xml application/json application/xml application/xml + rss;
  gzip_vary on;
  listen 80;
  location/{
    # Location related configuration is omitted here
  }
}
For the meaning and value of specific configuration items, you can check the relevant documents.
3.3 Automatically introduce element-plus on demand
The author’s project originally introduced element-plus completely. The content of the main.ts file:
import ElementPlus from 'element-plus'
import 'element-plus/dist/index.css'
import App from './App.vue'

const app = createApp(App)

app.use(ElementPlus)
app.mount('#app')
This will cause all js and css resources packaged and related to element-plus to be imported when the homepage is loaded, but when imported on demand, all css and js will not be imported at once.
The method to introduce element-plus on demand is:
Step one: Install unplugin-auto-import and unplugin-vue-components: pnpm install unplugin-auto-import unplugin-vue-components.
Step 2: vite.config.ts plug-in configuration:
import AutoImport from "unplugin-auto-import/vite";
import Components from "unplugin-vue-components/vite";
import { ElementPlusResolver } from "unplugin-vue-components/resolvers";
export default defineConfig({
  plugins:[
    AutoImport({
      resolvers: [ElementPlusResolver()]
    }),
    Components({
      resolvers: [ElementPlusResolver()]
    }),
  ]
})
Step 3: Processing of special plug-ins. For components used in an imperative manner, such as ElNotification, if they are not introduced separately, their styles will become invalid. Therefore, it is necessary to globally introduce such components used in the project separately:
import { ElInput, ElSelect, ElDatePicker, ElTimePicker } from "element-plus";
app.use(ElInput).use(ElSelect).use(ElDatePicker).use(ElTimePicker).use(directives).use(router).use(pinia).mount("#app");
3.4 Modify the introduction method of Baidu Map
The original introduction method is to add script tags to the html file:
<!DOCTYPE html>
<html lang="en">
  <body>
    <div id="app">
    <script type="module" src="/src/main.ts"></script>
    <script charset="utf-8" src="//i2.wp.com/api.map.baidu.com/api?v=1.0 & amp; & amp;type=webgl & amp;ak=*** "></script>
  </body>
</html>
The original usage is as follows:
const BMapGL: any = (window as any).BMapGL;
 const map = new BMapGL.Map("container");
Change to asynchronous reference when using:
const LoadBaiduMapScript = () => {
  //console.log("Initialize Baidu map script...");
  const AK = "***";
  const BMap_URL = "https://api.map.baidu.com/api?v=1.0 & amp; & amp;type=webgl & amp;ak=" + AK + " & amp;s=1 & amp;callback =onBMapCallback";
  return new Promise(resolve => {
    // Return directly if loaded
    if (typeof (window as any).BMapGL !== "undefined") {
      resolve((window as any).BMapGL);
      return true;
    }
    // Baidu map asynchronous loading callback processing
    (window as any).onBMapCallback = () => {
      console.log("Baidu map script initialization successful...");
      BMapGL = (window as any).BMapGL;
      resolve((window as any).BMapGL);
    };
    //Insert script script
    let scriptNode = document.createElement("script");
    scriptNode.setAttribute("type", "text/javascript");
    scriptNode.setAttribute("src", BMap_URL);
    document.body.appendChild(scriptNode);
  });
};
3.5 Compress images
Here we recommend a useful compression tool, Panda Compression – tinypng.

Use it to compress the cutouts, background images, etc. provided by the UI, which will definitely play a certain role.
The author optimized the project through the above five optimization methods, and the performance score has been greatly improved. Do you think performance optimization is not difficult, hahaha~
Node community
I have formed a Node.js community with a very good atmosphere. There are many Node.js friends in it. If you are interested in learning Node.js (you can also have plans in the future), we can do Node.js-related work together. Exchange, learn and build together. Add Koala friends below and reply “Node”.

"Share, Like, Watch" to support