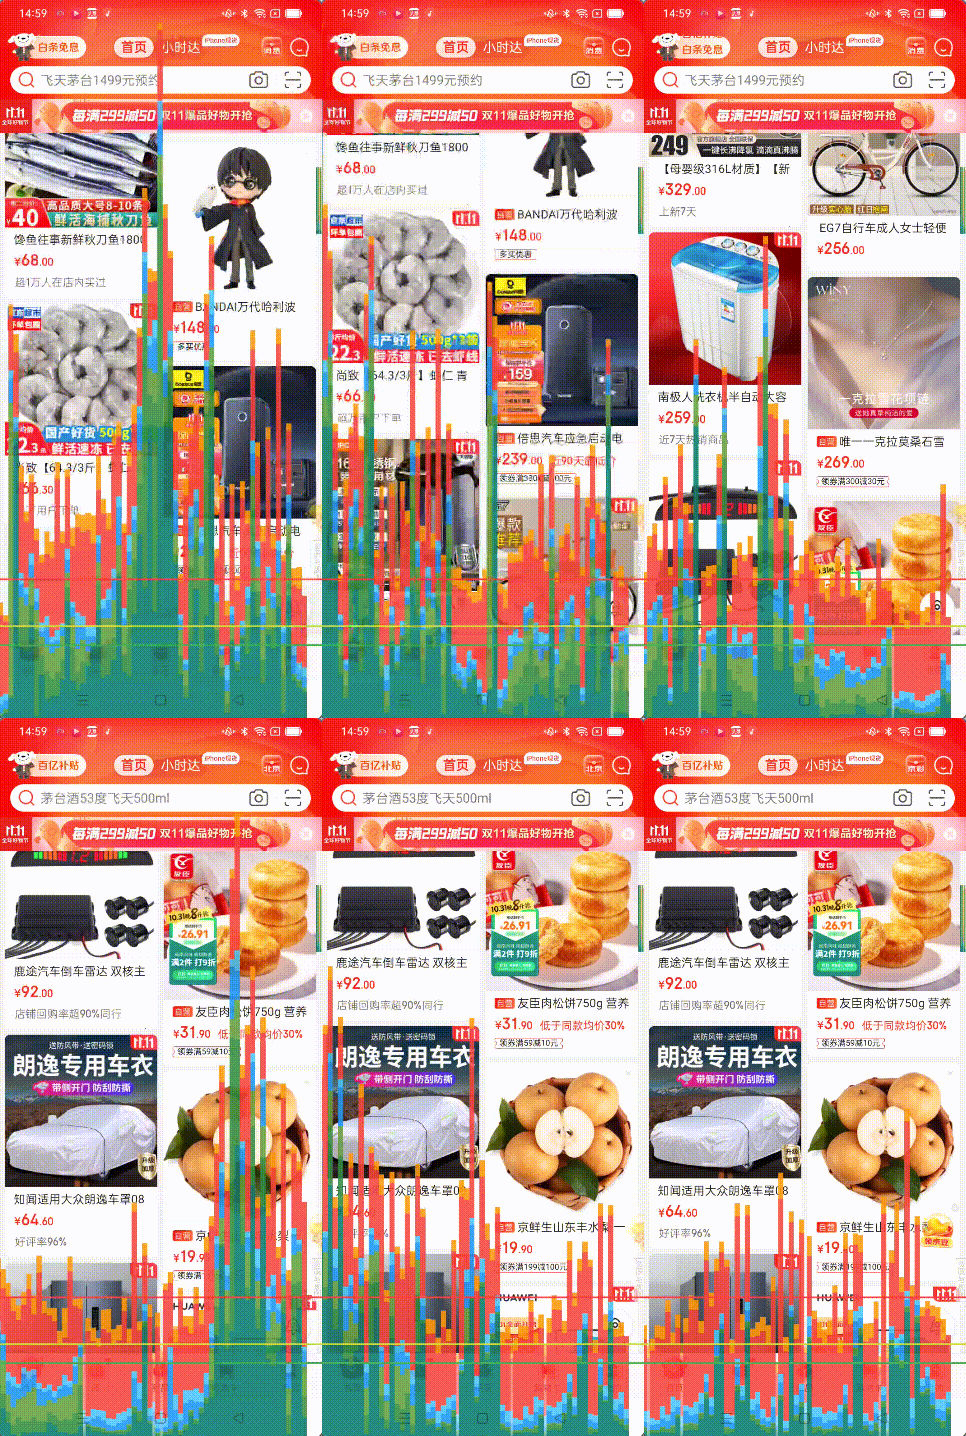
The rendering time of lag is as shown below:

Caton performance has the following aspects:
- Network image rendering takes a long time
- The response of sliding up and down is slow, and the screen may even not move.
- It takes a lot of time to load and render a new page of data. There is almost no response when sliding up and down. The screen stops and there is no interactive response.
Background
In fact, this set of data loading logic has been running for almost more than a year, and there were no such problems before. The author took over later and didn’t think there was any problem. Maybe it was because the amount of data was so small at first that I couldn’t see it.
As of today, the designed volume of business data is 3,650, and the actual number of business data is about 1,100; this volume of business data was not particularly large originally. So I didn’t think there was a problem.
When the data volume of other business groups increased, the list data became so stuck that it was almost unusable. By chance, the leader found out about it, so this optimization was carried out.
The original design is as follows:
List layout:
 <android.support.v4.widget.NestedScrollView
            android:id="@ + id/nestedScrollView"
            android:layout_width="match_parent"
            android:layout_height="match_parent"
            android:fillViewport="true"
            app:layout_behavior="@string/appbar_scrolling_view_behavior">

            <live.bingoogolapple.refreshlayout.BGARefreshLayout
                android:id="@ + id/mRefreshLayout"
                android:layout_width="match_parent"
                android:layout_height="match_parent"
                app:layout_behavior="@string/appbar_scrolling_view_behavior">

                <android.support.v7.widget.RecyclerView
                    android:id="@ + id/recycleView_playback"
                    android:layout_width="match_parent"
                    android:layout_height="wrap_content"
                    android:background="#FFFFFFFF"
                    android:nestedScrollingEnabled="false"
                    android:paddingLeft="20dp"
                    android:paddingRight="10dp"
                    android:paddingBottom="8dp"
                    app:layout_behavior="@string/appbar_scrolling_view_behavior" />
            </live.bingoogolapple.refreshlayout.BGARefreshLayout>
        </android.support.v4.widget.NestedScrollView>
RecyclerView.Adapter data loading is similar to the following:
RecyclerView.Adapter is one of the key components used to display data in RecyclerView. Here are the basic steps for using RecyclerView.Adapter:
- Create a custom Adapter class: First, you need to create a custom Adapter class inherited from RecyclerView.Adapter. This class is responsible for managing the data collection and binding the data to the ViewHolder of RecyclerView.
public class MyAdapter extends RecyclerView.Adapter<MyAdapter.MyViewHolder> {<!-- -->
    // Adapter code
}
- Create a ViewHolder class: In the custom Adapter class, you need to create an internal class inherited from RecyclerView.ViewHolder to represent the view of each child item in the RecyclerView.
public class MyAdapter extends RecyclerView.Adapter<MyAdapter.MyViewHolder> {<!-- -->
    public static class MyViewHolder extends RecyclerView.ViewHolder {<!-- -->
        // Code for ViewHolder
    }
}
- Methods to implement Adapter: In the custom Adapter class, you need to implement some methods, such as onCreateViewHolder, onBindViewHolder, getItemCount, etc. These methods are used to create ViewHolder, bind data to ViewHolder, get the size of the data collection, etc.
public class MyAdapter extends RecyclerView.Adapter<MyAdapter.MyViewHolder> {<!-- -->
    @Override
    public MyViewHolder onCreateViewHolder(ViewGroup parent, int viewType) {<!-- -->
        //Create ViewHolder
    }

    @Override
    public void onBindViewHolder(MyViewHolder holder, int position) {<!-- -->
        // Bind data to ViewHolder
    }

    @Override
    public int getItemCount() {<!-- -->
        // Get the size of the data collection
    }
}
- Create a ViewHolder in the onCreateViewHolder method: In the onCreateViewHolder method, you need to create and return a ViewHolder object to represent the view of each child item in the RecyclerView.
public class MyAdapter extends RecyclerView.Adapter<MyAdapter.MyViewHolder> {<!-- -->
    @Override
    public MyViewHolder onCreateViewHolder(ViewGroup parent, int viewType) {<!-- -->
        //Create ViewHolder
        View itemView = LayoutInflater.from(parent.getContext()).inflate(R.layout.item_layout, parent, false);
        return new MyViewHolder(itemView);
    }
}
- Bind data to ViewHolder in the onBindViewHolder method: In the onBindViewHolder method, data needs to be bound to the ViewHolder in order to be displayed in the RecyclerView.
public class MyAdapter extends RecyclerView.Adapter<MyAdapter.MyViewHolder> {<!-- -->
    @Override
    public void onBindViewHolder(MyViewHolder holder, int position) {<!-- -->
        // Bind data to ViewHolder
        MyData data = dataList.get(position);
        holder.bindData(data);
    }
}
- Associate the Adapter with the RecyclerView: Finally, you need to associate the custom Adapter with the RecyclerView to display data in the RecyclerView.
RecyclerView recyclerView = findViewById(R.id.recycler_view);
MyAdapter adapter = new MyAdapter(dataList);
recyclerView.setAdapter(adapter);
In the above code, dataList is the data collection, and R.layout.item_layout is the layout file for each child item. Through the above steps, you can use RecyclerView.Adapter to display data in RecyclerView.
Usage of Glide image loading library
 Glide.with(context)
 .load(imgUrl)
                        .into(holder.imageview);
BGARefreshLayout pulls up to load more components and uses methods to overlay NestedScrollView
 BGARefreshViewHolder bgaNormalRefreshViewHolder = new BGANormalRefreshViewHolder(this, true);
        mRefreshLayout.setRefreshViewHolder(bgaNormalRefreshViewHolder);

        nestedScrollView = findViewById(R.id.nestedScrollView);

        if (Build.VERSION.SDK_INT >= Build.VERSION_CODES.M) {<!-- -->
            nestedScrollView.setOnScrollChangeListener(new View.OnScrollChangeListener() {<!-- -->
                @Override
                public void onScrollChange(View view, int scrollX, int scrollY, int oldScrollX, int oldScrollY) {<!-- -->
                    NestedScrollView toNesstedScrollView = (NestedScrollView) view;

                    if (scrollY < 5
                            || toNesstedScrollView.getChildAt(0).getMeasuredHeight()
                            == view.getMeasuredHeight()) {<!-- -->
                        return;
                    }
                    int height = toNesstedScrollView.getChildAt(0).getMeasuredHeight()
                            - view.getMeasuredHeight();
                    if (scrollY == height) {<!-- -->
                        //Set the proxy for BGARefreshLayout
                        if(mRefreshLayout.getDelegate()==null){<!-- -->
                             mRefreshLayout.setDelegate(XXXXActivity.this);
                        }
                        mRefreshLayout.beginLoadingMore();
                    }
                }
            });
        }
There is not much to write in the memory, and there are basically no memory problems
Set optimization direction and goals
The origin of screen lag
Android screen rendering 16ms bar chart refers to the visual display of the time spent on screen rendering in the form of a bar chart in Android applications. This bar chart is often used to monitor application performance, specifically the time spent drawing the UI.
In Android, 60 frames of the screen need to be rendered per second, which means that the time limit for each frame is 16 milliseconds (1 second = 1000 milliseconds / 60 frames ≈ 16.67 milliseconds). If the screen takes longer than 16 milliseconds to render, it will cause frame drops (screen stuttering).
Each bar in the bar chart represents one frame of rendering time. If the pillar height exceeds 16 milliseconds, it means that the frame’s rendering time exceeds the ideal 16 millisecond limit. A higher bar indicates longer rendering times, and your application’s performance may be affected.
By observing the column chart, developers can determine whether the application has performance problems when drawing the UI and optimize accordingly. The optimization goal is to try to keep the rendering time of each frame within 16 milliseconds to ensure a smooth user experience.
- The blue part represents the drawing time or the time when the display list is created and updated in the Java layer. Before a View can actually be rendered, it needs to be converted into a format that the GPU can recognize. To put it simply, it may be just a few drawing commands. If it is more complicated, we may embed a custom path obtained from canvas. After this step is completed, the output results will be cached by the system as a display list. The blue part records the time it takes for this frame to complete these two steps for all views that need to be updated. When it is very high, it means that many views are suddenly invalidated (invalidate), or there are several custom views that have particularly complex drawing logic in the onDraw function.
Optimization direction 1: Clean up the view components that are not used or set to invalidate in the layout xml, and reduce the layout nesting level - The red part represents the execution time, which is the time when the Android 2D rendering engine (OpenGL) executes the display list. In order to draw changes on the screen, Android needs to use the OpenGL ES API to draw these display list information. OpenGL finally passes the data to the GPU, and then the GPU renders it to the screen. The more complex the View, the more complex the commands required for OpenGL drawing. If the red section is relatively high, complex views may be the culprit. It is also worth noting that there is a relatively large peak value, which indicates that some views have been submitted repeatedly, that is, they have been drawn multiple times, and they may not need to be redrawn.
Optimization direction two: adopt local update view strategy - The orange part represents processing time, and furthermore, the time it takes for the CPU to tell the GPU that rendering has completed. This part is blocked. The CPU will wait for the GPU to know that it has received the command. If it is relatively high, it means that the GPU is doing too many tasks. This is usually due to many complex view drawings that require too many OpenGL rendering commands to process.
Look at the rendering time chart below. It’s broken on the screen, and the red line at the bottom is missing!

Turn on the switch for rendering time-consuming graphs
Generally in Developer Options-GPU rendering mode analysis:

Set the optimization goal as the interactive performance of JD.com’s homepage on the same device
The interaction smoothness of JD.com’s homepage is as follows:

The crux of the current problem will be analyzed in the following stages
- Whether the current design meets interaction fluency. Can the smoothness reach the experience of JD.com’s home page? Design data only loads text; load static images after text; test and verify the interactive somatosensory situation of current layout and data logic loading. If it is not satisfied, it can be basically determined that the layout and data loading logic are defective, and they need to be reconstructed or rewritten.
- On the basis that item 1 is satisfied, test that the same network image is loaded and displayed in all list items. Record interactive somatosensory and JD homepage for comparative analysis
- Test the single-column dynamic image loading effect and record it
- Test the double-column dynamic image loading effect again and record it
More optimization records are as follows:
【Android】Analysis of key points of screen lag 2
[Android] Screen freeze, optimize list fluency, RecyclerView refresh mechanism notifyItemRangeInserted
Recommended smartApi interface development tools
Reason for recommendation
It has become increasingly difficult to use postman in the country:
1. Serious login problem
2. The Mock function service is basically unusable.
3. The version update function is already lacking.
4. Some external factors make it risky to use postman in the future.
For the above considerations, the author developed an API debugging and development tool SmartApi to meet the basic daily development and debugging API needs.
Introduction
After more than a year and a half of development, the smartApi-v1.0.0 version was officially launched at 10pm on September 15, 2023
smartApi is an API debugging and development tool that benchmarks against foreign postman. Since the development manpower is only the author, the manpower is limited, so the functions of the v1.0.0 version have been streamlined. The major functional items are:
- Fill in api parameters
- api request response data display
- Share documents in PDF format
- Mock localization solution
- API list data localization processing
- Plus UI polishing
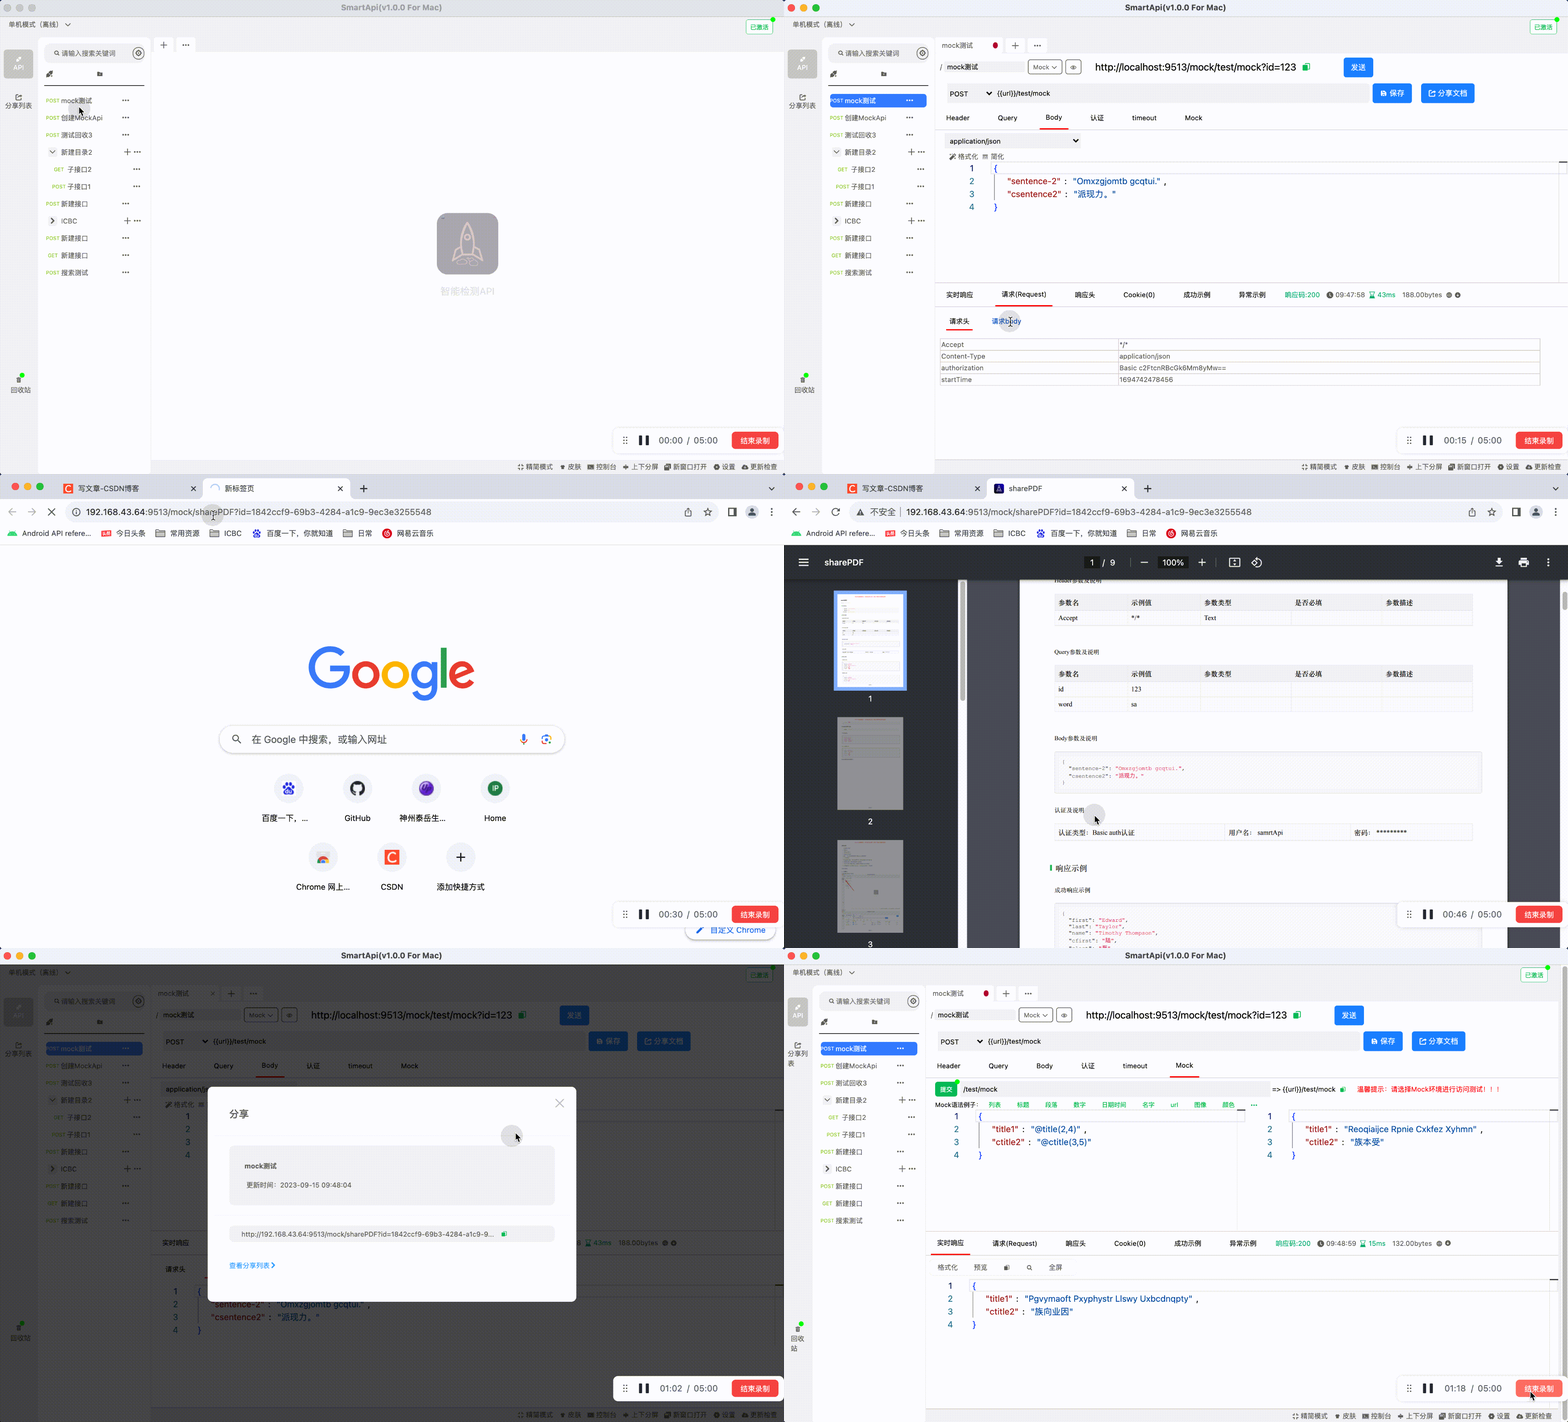
The following is an introduction to the use of smartApi:

Download address:
https://pan.baidu.com/s/1kFAGbsFIk3dDR64NwM5y2A?pwd=csdn