jstack java stack tracing tool
1. Introduction to jstack
jstack (stack trace for java) is a stack tracing tool that comes with the Java virtual machine.
jstack is mainly used to generate a thread snapshot of the current moment of the Java virtual machine. The thread snapshot is the method currently being executed by each thread in the Java virtual machine.
A collection of stacks. The main purpose of generating thread snapshots is to locate the reasons for long pauses in threads, such as inter-thread deadlocks, infinite loops, and requests for external resources.
Resulting in long waits.
When a thread pauses, use jstack to view the call stack of each thread, and you can know what the unresponsive thread is doing in the background.
situation, or what resources to wait for.
jstack is mainly divided into two functions:
- Do a local or remote thread dump for live processes
- Do thread dump for core file
When the specified process is running on a 64-bit Java virtual machine, you may need to specify the -J-d64 option, for example: jstack -J-d64 -m pid.
2. Thread status
Threads usually have the following five states:
1. New state (New): A new thread object is created.
2. Ready state (Runnable): After the thread object is created, other threads call the start() method of the object. The thread in this state is located in the
? Run in the thread pool, become runnable, and wait to obtain the right to use the CPU.
3. Running: The thread in the ready state obtains the CPU and executes the program code.
4. Blocked: The blocked state means that the thread gives up the right to use the CPU for some reason and temporarily stops running. Until the thread enters
? Ready state, have the opportunity to transfer to the running state. There are three types of blocking situations:
Waiting for blocking: The running thread executes the wait() method, and the JVM will put the thread into the waiting pool.
Synchronous blocking: When a running thread acquires the synchronization lock of an object, if the synchronization lock is occupied by another thread, the JVM will put the thread into the lock pool.
middle.
Other blocking: When a running thread executes the sleep() or join() method, or issues an I/O request, the JVM will put the thread into a blocked state.
When the sleep() state times out, join() waits for the thread to terminate or times out, or the I/O processing is completed, the thread returns to the ready state.
5. Dead status (Dead): The thread has finished executing or exited the run() method due to an exception, and the thread ends its life cycle.
Regarding thread status, you can also view the details: java.lang.Thread.State class.

If you want to analyze the situation of threads through the jstack command, you must first know what states the threads have. The following states are what we use the jstack command.
Let’s look at several states of threads that you may see when viewing thread stack information:
- RUNNABLE, the thread is running or I/O waiting
- BLOCKED, the thread is blocked, waiting for the monitor lock (synchronized keyword)
- TIMED_WAITING , the thread is waiting to wake up, but a time limit is set
- WAITING, the thread is waiting infinitely to wake up
In the thread stack, you need to pay special attention to the following states:
- Deadlock: Deadlock (focus)
- Waiting on condition: Waiting for resources (focus)
- Waiting on monitor entry: Waiting to obtain the monitor (focus)
- Blocked: blocking (focus)
- Runnable: executing
- Suspended: Suspended
- Object.wait() or TIME_WAITING: The object is waiting
- Parked: Stopped
3. jstack command format
jstack [option] pid
jstack [option] executable core
jstack [ option ] [server-id@]remote-hostname-or-IP
pid: The ID of the Java process, which can be queried through the jps command.
executable: Java executable program that generates core dump.
core: The core file of the stack trace to be printed.
server-id: Optional unique ID that can be used when multiple DEBUG servers are running on the same remote host.
remote-hostname-or-IP: The remote DEBUG server host name or IP address.
pid: The java process ID that needs to be printed with configuration information can be queried with jps.
Description of commonly used parameters:
-F: Force a stack dump to be printed when jstack [-l] pid is unresponsive.
-l: Print other information about the lock, such as the list of owned java.util.concurrent ownable synchronizers, which will make
The JVM pauses much longer.
-m: Print a mixed-mode stack trace containing Java and native C/C++ frames.
-h: Print help information.
-help: Print help information.
3.1 jstack pid

Analysis of each word in the first line,
-
daemon: Thread name. -
prio: Thread priority -
tid: refers to Java Thread id. -
nid: refers to the id of the native thread. . -
[0x000000002369e000]: Thread stack starting address.
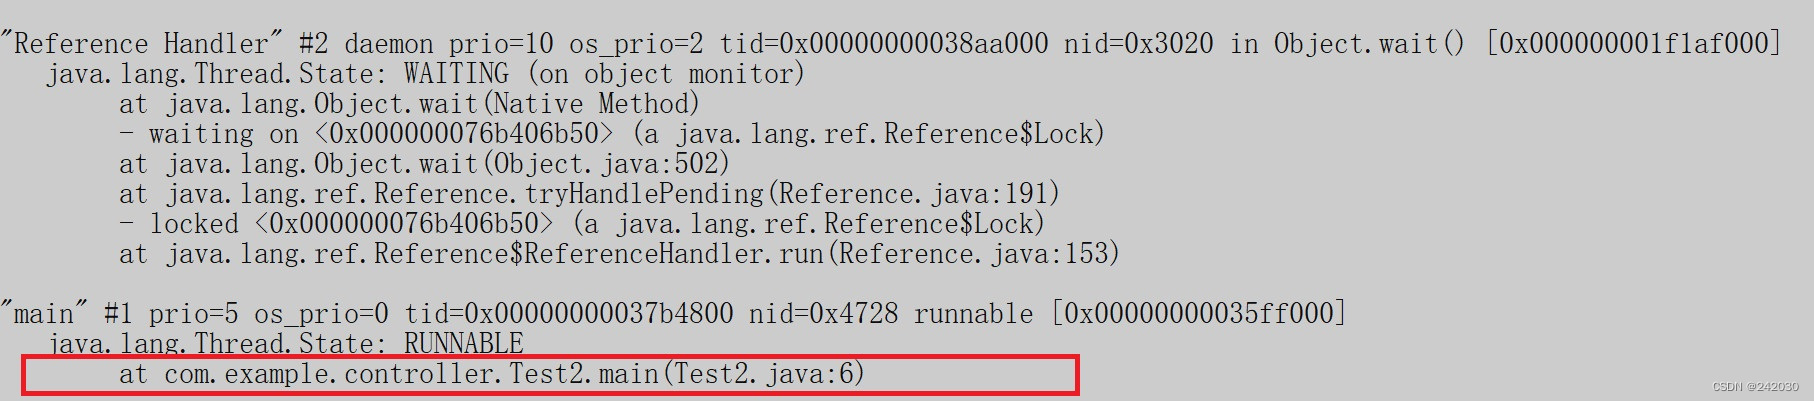
3.2 Infinite Loop
package com.example.controller;

public class Test2 {<!-- -->

    public static void main(String[] args) {<!-- -->
        while (true) {<!-- -->
        }
    }

}
3.3 Object.wait() situation
package com.example.controller;

import java.util.concurrent.ExecutorService;
import java.util.concurrent.Executors;

public class Test3 {<!-- -->
    static class TestTask implements Runnable {<!-- -->
        @Override
        public void run() {<!-- -->
            synchronized (this) {<!-- -->
                try {<!-- -->
                    //wait to be woken up
                    wait();
                } catch (InterruptedException e) {<!-- -->
                    e.printStackTrace();
                }
            }
        }
    }

    public static void main(String[] args) {<!-- -->
        ExecutorService ex = Executors.newFixedThreadPool(1);
        ex.execute(new TestTask());
    }
}

3.4 Deadlock situation
package com.example.controller;

import java.util.concurrent.ExecutorService;
import java.util.concurrent.Executors;

public class Test4 {<!-- -->

    public static void main(String[] args) {<!-- -->
        Object obj1 = new Object();
        Object obj2 = new Object();
        ExecutorService ex = Executors.newFixedThreadPool(2);
        // Start 10 threads
        for (int i = 0; i < 10; i + + ) {<!-- -->
            int order = i % 2 == 0 ? 1 : 0;
            ex.execute(new TestTask(order, obj1, obj2));
        }
    }

    static class TestTask implements Runnable {<!-- -->
        privateObject obj1;
        privateObject obj2;
        private int order;

        public TestTask(int order, Object obj1, Object obj2) {<!-- -->
            this.order = order;
            this.obj1 = obj1;
            this.obj2 = obj2;
        }

        public void test1() throws InterruptedException {<!-- -->
            synchronized (obj1) {<!-- -->
                synchronized (obj2) {<!-- -->
                    System.out.println("test...");
                }
            }
        }

        public void test2() throws InterruptedException {<!-- -->
            synchronized (obj2) {<!-- -->
                synchronized (obj1) {<!-- -->
                    System.out.println("test...");
                }
            }
        }

        @Override
        public void run() {<!-- -->
            while (true) {<!-- -->
                try {<!-- -->
                    if (this.order == 1) {<!-- -->
                        this.test1();
                    } else {<!-- -->
                        this.test2();
                    }
                } catch (InterruptedException e) {<!-- -->
                    e.printStackTrace();
                }
            }
        }
    }
}

3.5 Waiting for io
package com.example.controller;

import java.io.IOException;
import java.io.InputStream;

public class Test5 {<!-- -->

    public static void main(String[] args) throws IOException {<!-- -->
        InputStream is = System.in;
        int i = is.read();
        System.out.println("exit.");
    }

}
