Prometheus + grafana + multiple indicator collectors
In this case prometheus is installed on the host 128.5.80.182
1 Install prometheus main program
1.1 Installation
#Unzip the installation package
tar zxvf prometheus-2.44.0.linux-amd64.tar.gz

#Move the folder to the specified location
cd prometheus-2.44.0.linux-amd64
mv */home/ap/prometheus

#Create startup command to environment variable
ln -s /home/ap/prometheus/prometheus /usr/local/bin/prometheus

##Verify Prometheus installation version
prometheus --version

1.2 Create related directories
mkdir -p /home/ap/prometheus/log ##Storage log directory
mkdir -p /home/ap/prometheus/data ##Store monitoring data directory
1.3 Startup method
##Startup method 1 (not recommended, it will run in the foreground and the window cannot be closed)
prometheus --config.file=/home/ap/prometheus/prometheus.yml --web.enable-lifecycle

##Startup method 2 (start in the background and generate logs into the prometheus.log file)
nohup prometheus --config.file=/home/ap/prometheus/prometheus.yml \
--storage.tsdb.path=/home/ap/prometheus/data --web.enable-lifecycle > /home/ap/prometheus/log/prometheus.log 2> & amp;1 & amp;

##Startup method 3, to start the service, can be controlled through systemctl
Don’t configure it yet
1.4 Access via browser
http://128.5.80.182:9090/metrics

2 node_exporter node exporter
node_exporter can collect indicators of various aspects of the operating system, such as CPU, memory, hard disk, network, IO and other information. The graphic display effect through grafana is as shown below:

2.1 Install node exporter
#Extract and move to the specified location on each node that needs to be monitored
cd /home/ap/Prometheus
tar zxvf node_exporter-1.5.0.linux-amd64.tar.gz
mv node_exporter-1.5.0.linux-amd64 /home/ap/prometheus/node_exporter
2.2 Start node_exporter
#Startup:
nohup /home/ap/prometheus/node_exporter/node_exporter >/dev/null 2> & amp;1 & amp;
2.3 Configure prometheus.yml
Add the following configuration information to scrape_configs: below
scrape_configs:
  - job_name: "node"
    file_sd_configs:
    - files:
      - targets/nodes.yml
      refresh_interval: 2m
    scrape_interval: 15s
    static_configs:
      - targets:

Configure monitoring list
vi /home/ap/prometheus/targets/nodes.yml
- targets:
  - 128.5.80.160:9100
  - 128.5.80.95:9100
  - 128.5.80.96:9100
  - 128.5.80.97:9100
  - 128.1.80.43:9100
  - 128.5.80.182:9100

2.4 Restart the prometheus main program
#Kill the old process
ps -ef |grep Prometheus
kill -9 xxxx
#Start new process
nohup prometheus --config.file=/home/ap/prometheus/prometheus.yml \
--storage.tsdb.path=/home/ap/prometheus/data --web.enable-lifecycle > /home/ap/prometheus/log/prometheus.log 2> & amp;1 & amp;
3 Install oracledb_exporter exporter
Oracledb_exporter can monitor ORACLE database-related indicators, such as table space, session status, parsing status, and waiting status. The graphic display effect through grafana is as shown below:

There are several ways to monitor Oracle database,
1. You can place the exporter on each database server that needs to be monitored.
2. You can install the exporter on the prometheus server. This method can be installed only once. The exporter process is all on the monitoring server side, which will not have any impact on the database server. Put the pressure on the monitoring server side.
This time the installation of the environment is deployed according to the second method.
3.1 Install the exporter
##Unzip
tar zxvf oracledb_exporter.0.3.0rc1-ora18.5.linux-amd64.tar.gz
mv oracledb_exporter.0.3.0rc1-ora18.5.linux-amd64 oracledb_exporter
3.2 Configure environment variables
##Configure environment variables under root to connect to the database from the monitoring terminal
export ORACLE_HOME=/home/db/oracle/product/19.3.0
export PATH=$PATH:/home/db/oracle/product/19.3.0/bin
export LD_LIBRARY_PATH=:/home/db/oracle/product/19.3.0/lib

3.3 Test database connectivity
##Create a unified monitoring account on each database with as few permissions as possible
create user prometheus identified by Abcd_123;
grant create session to prometheus;
grant select_catalog_role to prometheus;
##Test connectivity
sqlplus prometheus/[email protected]:11521/clouddb
sqlplus prometheus/[email protected]:11521/nbutf8db
sqlplus prometheus/[email protected]:1521/odsbptdb
sqlplus prometheus/[email protected]:11522/zyqdb
sqlplus prometheus/[email protected]:1521/jstsptdb
sqlplus prometheus/[email protected]:1522/P8UTF8DB
sqlplus prometheus/[email protected]:11521/jstsptdb
sqlplus prometheus/[email protected]:11521/nbutf8db
sqlplus prometheus/[email protected]:11521/jstsptdb
sqlplus prometheus/[email protected]:11521/nbutf8db
sqlplus prometheus/[email protected]:11521/jstsptdb
3.4 Start the exporter
One exporter per database
#library1
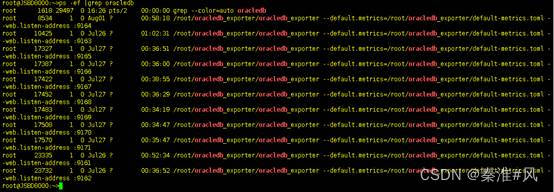
export DATA_SOURCE_NAME=prometheus/[email protected]:11521/clouddb

nohup /root/oracledb_exporter/oracledb_exporter --default.metrics=/root/oracledb_exporter/default-metrics.toml --web.listen-address :9161 >/dev/null 2> & amp;1 & amp;

#Check whether monitoring data can be obtained

curl http://128.5.80.182:9161/metrics
#library2
export DATA_SOURCE_NAME=prometheus/[email protected]:11521/nbutf8db

nohup /root/oracledb_exporter/oracledb_exporter --default.metrics=/root/oracledb_exporter/default-metrics.toml --web.listen-address :9162 >/dev/null 2> & amp;1 & amp;

#Check whether monitoring data can be obtained

curl http://128.5.80.182:9162/metrics
#Library3.
export DATA_SOURCE_NAME=prometheus/[email protected]:1521/odsbptdb

nohup /root/oracledb_exporter/oracledb_exporter --default.metrics=/root/oracledb_exporter/default-metrics.toml --web.listen-address :9163 >/dev/null 2> & amp;1 & amp;

#Check whether monitoring data can be obtained

curl http://128.5.80.182:9163/metrics
Other libraries can be deduced by analogy
3.5 Configure prometheus.yml
Add the following configuration information to scrape_configs: below
 - job_name: "oracle"
    file_sd_configs:
    - files:
      - targets/db.yml
      refresh_interval: 2m
    scrape_interval: 5m
    static_configs:
      - targets:
Configure monitoring list:
vi /home/ap/prometheus/targets/db.yml
- targets:
  - 128.5.80.182:9161
  labels:
    dbname: '80.182-clouddb'
- targets:
  - 128.5.80.182:9162
  labels:
    dbname: '80.97-nbutf8db'
- targets:
  - 128.5.80.182:9163
  labels:
    dbname: '80.160-odsbptdb'
- targets:
  - 128.5.80.182:9164
  labels:
    dbname: '80.160-zyqdb'
- targets:
  - 128.5.80.182:9165
  labels:
    dbname: '80.43-jstsptdb'
- targets:
  - 128.5.80.182:9166
  labels:
    dbname: '80.43-P8UTF8DB'
- targets:
  - 128.5.80.182:9167
  labels:
    dbname: '80.95-jstsptdb'
- targets:
  - 128.5.80.182:9168
  labels:
    dbname: '80.95-nbutf8db'
- targets:
  - 128.5.80.182:9169
  labels:
    dbname: '80.96-jstsptdb'
- targets:
  - 128.5.80.182:9170
  labels:
    dbname: '80.96-nbutf8db'
- targets:
  - 128.5.80.182:9171
  labels:
    dbname: '80.97-jstsptdb'
</code><img class="look-more-preCode contentImg-no-view" src="//i2.wp.com/csdnimg.cn/release/blogv2/dist/pc/img/newCodeMoreBlack. png" alt="" title="">
3.6 Restart the prometheus main program
#Kill the old process
ps -ef |grep Prometheus
kill -9 xxxx

#Restart new process
nohup prometheus --config.file=/home/ap/prometheus/prometheus.yml \
--storage.tsdb.path=/home/ap/prometheus/data --web.enable-lifecycle > /home/ap/prometheus/log/prometheus.log 2> & amp;1 & amp;
4 Install mysqld_exporter
mysqld_exporter can monitor mysql database related indicators, such as connection status, table lock status, etc. The graphic display effect through grafana is as shown below:

4.1 Install the mysqld_exporter exporter
##Unzip
cd /home/ap/prometheus
tar -zxvf mysqld_exporter-0.14.0.linux-amd64.tar.gz
mv mysqld_exporter-0.14.0.linux-amd64 mysqld_exporter
4.2 Create monitoring user
create user 'exporter'@'localhost' identified by 'Exporter_123';
grant process,replication client,select on *.* to 'exporter'@'localhost';
4.3 Add configuration file
vi /home/ap/prometheus/mysqld_exporter.cnf
[client]
host=127.0.0.1
port=3306
user=exporter
password=Exporter_123
4.4 Starting the exporter
nohup /home/ap/prometheus/mysqld_exporter/mysqld_exporter --config.my-cnf=/home/ap/prometheus/mysqld_exporter/mysqld_exporter.cnf 2> & amp;1 & amp;

 Check if data is collected
curl http://128.5.80.182:9104/metrics
4.5 Configure prometheus.yml
Add the following configuration information to scrape_configs: below
 - job_name: "mysql"
    file_sd_configs:
    - files:
      - targets/mysql.yml
      refresh_interval: 2m
    scrape_interval: 2m
    static_configs:
      - targets:
Configure monitoring list
vi /home/ap/prometheus/targets/mysql.yml
- targets:
  - 128.5.80.182:9104
4.6 Restart the prometheus main program
##Kill the old process
ps -ef |grep Prometheus
kill -9 xxxx

##Restart new process
nohup prometheus --config.file=/home/ap/prometheus/prometheus.yml \
--storage.tsdb.path=/home/ap/prometheus/data --web.enable-lifecycle > /home/ap/prometheus/log/prometheus.log 2> & amp;1 & amp;
5 Install wmware_exporter
Vmware_exporter can monitor virtual machine usage related indicators, and the monitoring effect is displayed through grafana as shown in the figure below:

5.1 Install docker environment
docker installation brief
5.2 Import wmware_exporter image
#Image file location
/home/ap/prometheus/vmware_exporter/vmware_exporter.tar.gz

#Import image
docker load -i vmware_exporter.tar.gz

#Confirm the import is successful
docker images
5.3 Edit configuration file
vi /home/ap/prometheus/vmware_exporter/config.env
[email protected]
VSPHERE_PASSWORD=Jsccb@123
VSPHERE_HOST=128.5.80.175
VSPHERE_IGNORE_SSL=TRUE
VSPHERE_SPECS_SIZE=2000
5.4 Start container
docker run -itd -p 9272:9272 --name vmware_exporter --env-file /home/ap/prometheus/vmware_exporter/config.env pryorda/vmware_exporter

Verify whether data can be collected
curl http://localhost:9272/metrics
http://128.5.80.182:9272/metrics
5.5 Configure prometheus.yml
Main configuration file, add the following content
 - job_name: "vmware_vcenter"
    file_sd_configs:
    - files:
      - targets/vmware_vcenter.yml
      refresh_interval: 2m
    scrape_interval: 2m
    static_configs:
      - targets:
Configure monitoring list
vi /home/ap/prometheus/targets/mysql.yml
- targets:
  - 128.5.80.182:9104
5.6 Restart the prometheus main program
##Kill the old process
ps -ef |grep Prometheus
kill -9 xxxx

##Restart new process
nohup prometheus --config.file=/home/ap/prometheus/prometheus.yml \
--storage.tsdb.path=/home/ap/prometheus/data --web.enable-lifecycle > /home/ap/prometheus/log/prometheus.log 2> & amp;1 & amp;
6 Install ipmi_exporter
Ipmi_exporter can monitor the status of various sensors in the physical chassis, such as fan sensors, temperature sensors, storage sensors, etc. The graphic display effect through grafana is as shown below:

6.1 Installation
#Need to install freeipmi
yum install freeipmi

#decompression
cd /home/ap/prometheus
tar -zxvf ipmi_exporter-1.6.1.linux-amd64.tar.gz
mv ipmi_exporter-1.6.1.linux-amd64 ipmi_exporter
6.2 Edit ipmi configuration file
vi /home/ap/prometheus/ipmi_exporter/ipmi_remote.yml

modules:
  default:
    user: "Administrator"
    pass: "Fence12#$"
    driver: "LAN_2_0"
    privilege: "user"
    timeout: 10000
    collectors:
    - bmc
    -ipmi
    - chassis
    exclude_sensor_ids:
    - 2
    - 29
    - 32
    - 50
    - 52
    - 55
</code><img class="look-more-preCode contentImg-no-view" src="//i2.wp.com/csdnimg.cn/release/blogv2/dist/pc/img/newCodeMoreBlack. png" alt="" title="">
6.3 Start ipmi_exporter exporter
cd /home/ap/prometheus/ipmi_exporter

./ipmi_exporter --config.file=/home/ap/prometheus/ipmi_exporter/ipmi_remote.yml &
#test
http://128.5.80.182:9290
#Test whether the income iLO address can capture data
iLO address: 128.5.80.147 128.5.80.148
6.4 Configure the prometheus.yml main configuration file
Add the following
 - job_name: "ipmi"
    params:
      module: ['default']
    scrape_interval: 1m
    scrape_timeout: 30s
    metrics_path: /ipmi
    scheme: http
    file_sd_configs:
    - files:
      - targets/ipmi.yml
      refresh_interval: 2m
    relabel_configs:
    - source_labels: [__address__]
      separator: ;
      regex: (.*)
      target_label: __param_target
      replacement: ${1}
      action:replace
    - source_labels: [__param_target]
      separator: ;
      regex: (.*)
      target_label: instance
      replacement: ${1}
      action:replace
    - separator: ;
      regex: .*
      target_label: __address__
      replacement: 128.5.80.182:9290
      action:replace
</code><img class="look-more-preCode contentImg-no-view" src="//i2.wp.com/csdnimg.cn/release/blogv2/dist/pc/img/newCodeMoreBlack. png" alt="" title="">
#Add monitoring point
vi /home/ap/prometheus/targets/ipmi.yml
- targets:
  - 128.5.80.148
  - 128.5.80.147
  - 128.5.80.149
  - 128.5.80.150
  - 128.5.80.222
  - 128.5.80.223
  - 128.5.80.141
  - 128.5.80.168
  - 128.5.80.139
  - 128.5.80.140
  - 128.5.80.240
  - 128.5.80.241
  - 128.5.80.242
  labels:
    job: ipmi_exporter
</code><img class="look-more-preCode contentImg-no-view" src="//i2.wp.com/csdnimg.cn/release/blogv2/dist/pc/img/newCodeMoreBlack. png" alt="" title="">
6.5 Restart prometheus
##Kill the old process
ps -ef |grep Prometheus
kill -9 xxxx

##Restart new process
nohup prometheus --config.file=/home/ap/prometheus/prometheus.yml \
--storage.tsdb.path=/home/ap/prometheus/data --web.enable-lifecycle > /home/ap/prometheus/log/prometheus.log 2> & amp;1 & amp;
7 Install grafana graphics software
The grafana graphics software cooperates with prometheus to display the data obtained by prometheus graphically to facilitate monitoring.
7.1 Install rpm package
rpm -ivh grafana-enterprise-9.4.10-1.x86_64.rpm
7.2 Execute the given service startup script
/bin/systemctl daemon-reload
/bin/systemctl enable grafana-server.service
/bin/systemctl start grafana-server.service
7.3 Access via browser
http://128.5.80.182:3000

The default password is admin/admin
7.4 Import monitoring display board template
Monitoring templates can be downloaded from the official website of grafana
The import method is as follows:


Here you can select the exhibition board template downloaded from the official website and import it.
8 Configure alarm rules
8.1 Create rule directory
cd /home/ap/prometheus
mkdir rules
8.2 Add directories to the prometheus.yml main configuration file
vi prometheus.yml
rule_files:
  - "rules/*.rules"
8.3 Create alarm rules
vi /home/ap/prometheus/rules/alerts.rules
groups:
  - name: disk_alerts
    rules:
      - alert: "Disk Alert"
        expr: (1-node_filesystem_avail_bytes{<!-- -->mountpoint=~".*"}/node_filesystem_size_bytes{<!-- -->mountpoint=~".*"})*100>90
        for: 1m
        labels:
          severity: "Severe Warning"
        annotations:
          summary: "Disk partition usage alarm"
          description: "Disk usage exceeds 90%"

  - name: tablespaces_alerts
    rules:
      - alert: "Table space usage alarm"
        expr: (1-oracledb_tablespace_free{<!-- -->type!="TEMPORARY"}/oracledb_tablespace_bytes{<!-- -->type!="TEMPORARY"})*100>90
        for: 5m
        labels:
          severity: "Severe Warning"
        annotations:
          summary: "Table space remaining space alarm"
          description: "Table space usage exceeds 90%"

  - name: Memory_alerts
    rules:
      - alert: "Memory Alert"
        expr: (1 - (node_memory_MemAvailable_bytes / (node_memory_MemTotal_bytes)))* 100>80
        for: 1m
        labels:
          severity: "minor warning"
       annotations:
         summary: "Memory usage warning"
         description: "Memory usage exceeds 80%"

  - name: cpu_alerts
    rules:
      - alert: "cpu alert"
        expr: 100-avg(irate(node_cpu_seconds_total{<!-- -->mode="idle"}[5m])) by (instance)*100>90
        for: 1m
        labels:
          severity: "Severe Warning"
        annotations:
          summary: "cpu usage alarm"
          description: "CPU usage exceeds 90% for 1 minute continuously"

  - name: sensors_alerts
    rules:
      - alert: "Sensor Alert"
        expr: ipmi_sensor_state > 0
        for: 1m
        labels:
          severity: "Sensor Alarm"
        annotations:
          summary: "Sensor Alarm"
          description: "Sensor Alarm"

  - name: fan_alerts
    rules:
      - alert: "Fan speed sensor alarm"
        expr: ipmi_fan_speed_state > 0
        for: 1m
        labels:
          severity: "Fan speed sensor alarm"
        annotations:
          summary: "Fan speed sensor alarm"
          description: "Fan speed sensor alarm"

  - name: power_alerts
    rules:
      - alert: "Power sensor alarm"
        expr: ipmi_power_state > 0
        for: 1m
        labels:
          severity: "Power sensor alarm"
        annotations:
          summary: "Power sensor alarm"
          description: "Power sensor alarm"

  - name: temperature_alerts
    rules:
      - alert: "Temperature sensor alarm"
        expr: ipmi_temperature_state > 0
        for: 1m
        labels:
          severity: "Temperature sensor alarm"
        annotations:
          summary: "Temperature sensor alarm"
          description: "Temperature sensor alarm"


  - name: voltage_alerts
    rules:
      - alert: "Voltage sensor alarm"
        expr: ipmi_voltage_state > 0
        for: 1m
        labels:
          severity: "Voltage sensor alarm"
        annotations:
          summary: "Voltage sensor alarm"
          description: "Voltage sensor alarm"
</code><img class="look-more-preCode contentImg-no-view" src="//i2.wp.com/csdnimg.cn/release/blogv2/dist/pc/img/newCodeMoreBlack. png" alt="" title="">
8.4 Restart prometheus
##Kill the old process
ps -ef |grep Prometheus
kill -9 xxxx

##Restart new process
nohup prometheus --config.file=/home/ap/prometheus/prometheus.yml \
--storage.tsdb.path=/home/ap/prometheus/data --web.enable-lifecycle > /home/ap/prometheus/log/prometheus.log 2> & amp;1 & amp;
8.5 View alarm information

Here you can see whether the created alarm rule has been triggered.
8.6 Display alarm data in grafana
The display effect is as shown below. Click on the number to view detailed alarm information.

For example, click on number 8 to see the specific alarm status of the table space as shown in the figure below

The steps to achieve the above effects are as follows:
8.6.1 Create a new alarm detailed information panel

8.6.2 Edit panel
Enter the query expression at mark 1: ALERTS{alertname=”Table space usage alarm”}
Note: The name within double quotes is the name of the alarm rule created earlier.
Select table at mark 2
Select instance at logo 3
Select table at mark 4

As shown in the red circle in the figure below, filter the items to be displayed, and turn off the previous options if you do not need to display the columns.

8.6.3 Save panel
After saving, you will get detailed table space disk warning information, as shown below

8.6.4 Get panel link information
The link information for obtaining this alarm information panel is as follows:


Copy this Link URL, you will use it later
8.6.5 Create a new alarm panel

8.6.6 Edit panel
Fill in the code sum(ALERTS{alertname=”Table space usage alarm”}) in the circle
Note: The name within double quotes is the name of the alarm rule created earlier.

Adjust parameters, select table for format, select instance for type, select stat for panel, and change the default 80 to 1 in thresholds.


Add link information

8.6.7 Save panel
After saving, you can achieve the effect shown at the beginning, and other monitoring indicators can be built in this way.