I recently built a LAN file transfer system that requires network traffic monitoring. Security software on the market has this function, but the interface is too small and inconvenient to view, so I designed this network traffic monitor.
Program interface:

First, check the network information. We can use the psutil library to obtain the network port information of the computer. The specific usage is
psutil.net_io_counters(pernic=True)
Calling this function, we can see a large list of information

In order to determine the type of object returned by this function, we might as well call type()

You can see that this is a dictionary type data, and its data structure is {“port name”: some kind of object,….}
We can use the “.” operator to get the value of its attribute, for example


In this program, we only need to extract bytes_sent and bytes_recv to extract the current number of bytes sent and received by a single port. For multiple ports, use a for loop That’s it;
 def get_network_bytes():
        """
        Get the number of bytes sent and received by the current port
        :return: The current number of bytes sent and received by each port
        """
        network_io = psutil.net_io_counters(pernic=True)
        bytes_now = {}
        for interface, io in network_io.items():
            bytes_now[interface] = {'Number of bytes uploaded': io.bytes_sent, 'Number of bytes downloaded': io.bytes_recv}
        return bytes_now
After obtaining the current number of bytes sent and received, combined with the number of bytes sent and received last time, you can calculate the current network rate. Subtract the number of bytes sent and received for the first time from the current number of bytes sent and received, and you can get the total traffic. , for convenience, we can design two functions to format the network rate:
 def format_speed(speed):
        """
        Get an intuitive network speed format
        :param speed: Internet speed Byte/s
        :return: Format network speed
        """
        if speed < 1024:
            return f"{speed} B/s"
        elif speed < 1048576:
            return f"{speed / 1024:.2f} KB/s"
        else:
            return f"{speed / 1048576:.2f} MB/s"

    def format_netdata(da):
        """
        Get intuitive traffic formats
        :param da: number of bytes
        :return: number of formatted bytes
        """
        if da < 1024:
            return f"{da} B"
        elif da < 1048576:
            return f"{da / 1024:.2f} KB"
        elif da < 1073741824:
            return f"{da / 1048576:.2f} MB"
        else:
            return f"{da / 1073741824:.2f} GB"
Encapsulate the above code and add hundreds of details to get the source code of the program:
import datetime
import os
import psutil
from tabulate import tabulate
import time


class NetworkTrafficMonitor:
    """
    Network traffic monitoring tools
    """

    def __init__(self):
        print("Network Traffic Monitor started...")

    def get_network_bytes(self):
        """
        Get the number of bytes sent and received by the current port
        :return: The current number of bytes sent and received by each port
        """
        network_io = psutil.net_io_counters(pernic=True)
        bytes_now = {}
        for interface, io in network_io.items():
            bytes_now[interface] = {'Number of bytes uploaded': io.bytes_sent, 'Number of bytes downloaded': io.bytes_recv}
        return bytes_now

    def format_speed(self, speed):
        """
        Get an intuitive network speed format
        :param speed: Internet speed Byte/s
        :return: Format network speed
        """
        if speed < 1024:
            return f"{speed} B/s"
        elif speed < 1048576:
            return f"{speed / 1024:.2f} KB/s"
        else:
            return f"{speed / 1048576:.2f} MB/s"

    def format_netdata(self, da):
        """
        Get intuitive traffic formats
        :param da: number of bytes
        :return: number of formatted bytes
        """
        if da < 1024:
            return f"{da} B"
        elif da < 1048576:
            return f"{da / 1024:.2f} KB"
        elif da < 1073741824:
            return f"{da / 1048576:.2f} MB"
        else:
            return f"{da / 1073741824:.2f} GB"

    def cmd_mode(self):
        """
        Monitor in cmd mode
        :return:
        """
        last_speed = self.get_network_bytes() # Get the current number of bytes sent and received, used to calculate network speed
        raw_speed = self.get_network_bytes() # Get the current number of bytes sent and received for a cumulative calculation of traffic

        #Create an initial byte number dictionary for operation
        raw = {}
        for interface, bytes1 in raw_speed.items():
            raw[interface] = [bytes1['Number of uploaded bytes'], bytes1['Number of downloaded bytes']]

        while True:
            time.sleep(1) # Wait one second
            network_speeds = self.get_network_bytes()#Get the current number of bytes sent and received once

            #Create the last byte number dictionary for operation
            last = {}
            for interface, bytes1 in last_speed.items():
                last[interface] = [bytes1['Number of uploaded bytes'], bytes1['Number of downloaded bytes']]

            data = []#List used to display data
            for interface, bytes1 in network_speeds.items():
                data.append([interface, self.format_speed(bytes1['Number of uploaded bytes'] - last[interface][0]),
                             self.format_speed(bytes1['Downloaded bytes'] - last[interface][1]),
                             self.format_netdata(bytes1['Number of uploaded bytes'] - raw[interface][0]),
                             self.format_netdata(bytes1['Downloaded bytes'] - raw[interface][1])])

            #Use the tabulate function in the tabulate library to generate table objects
            headers = ["Interface", "Upload rate", "Download rate", "Cumulative upload", "Cumulative download"]
            table = tabulate(data, headers, tablefmt="grid")

            #Print output form
            os.system("cls")
            print(f"____________________________________________________________________________\\
"
                  f"| |\\
"
                  f"| Monitoring network connections... Current time: {str(datetime.datetime.now())[:-3]} |\\
"
                  f"| Author: Y.d|")
            print(table)

            # update data
            last_speed = network_speeds

if __name__ == '__main__':
    monitor = NetworkTrafficMonitor()
    monitor.cmd_mode()
Draw a small icon:

Packaged with pyinstaller:
pyinstaller -F -i 1.bmp network traffic monitor.py

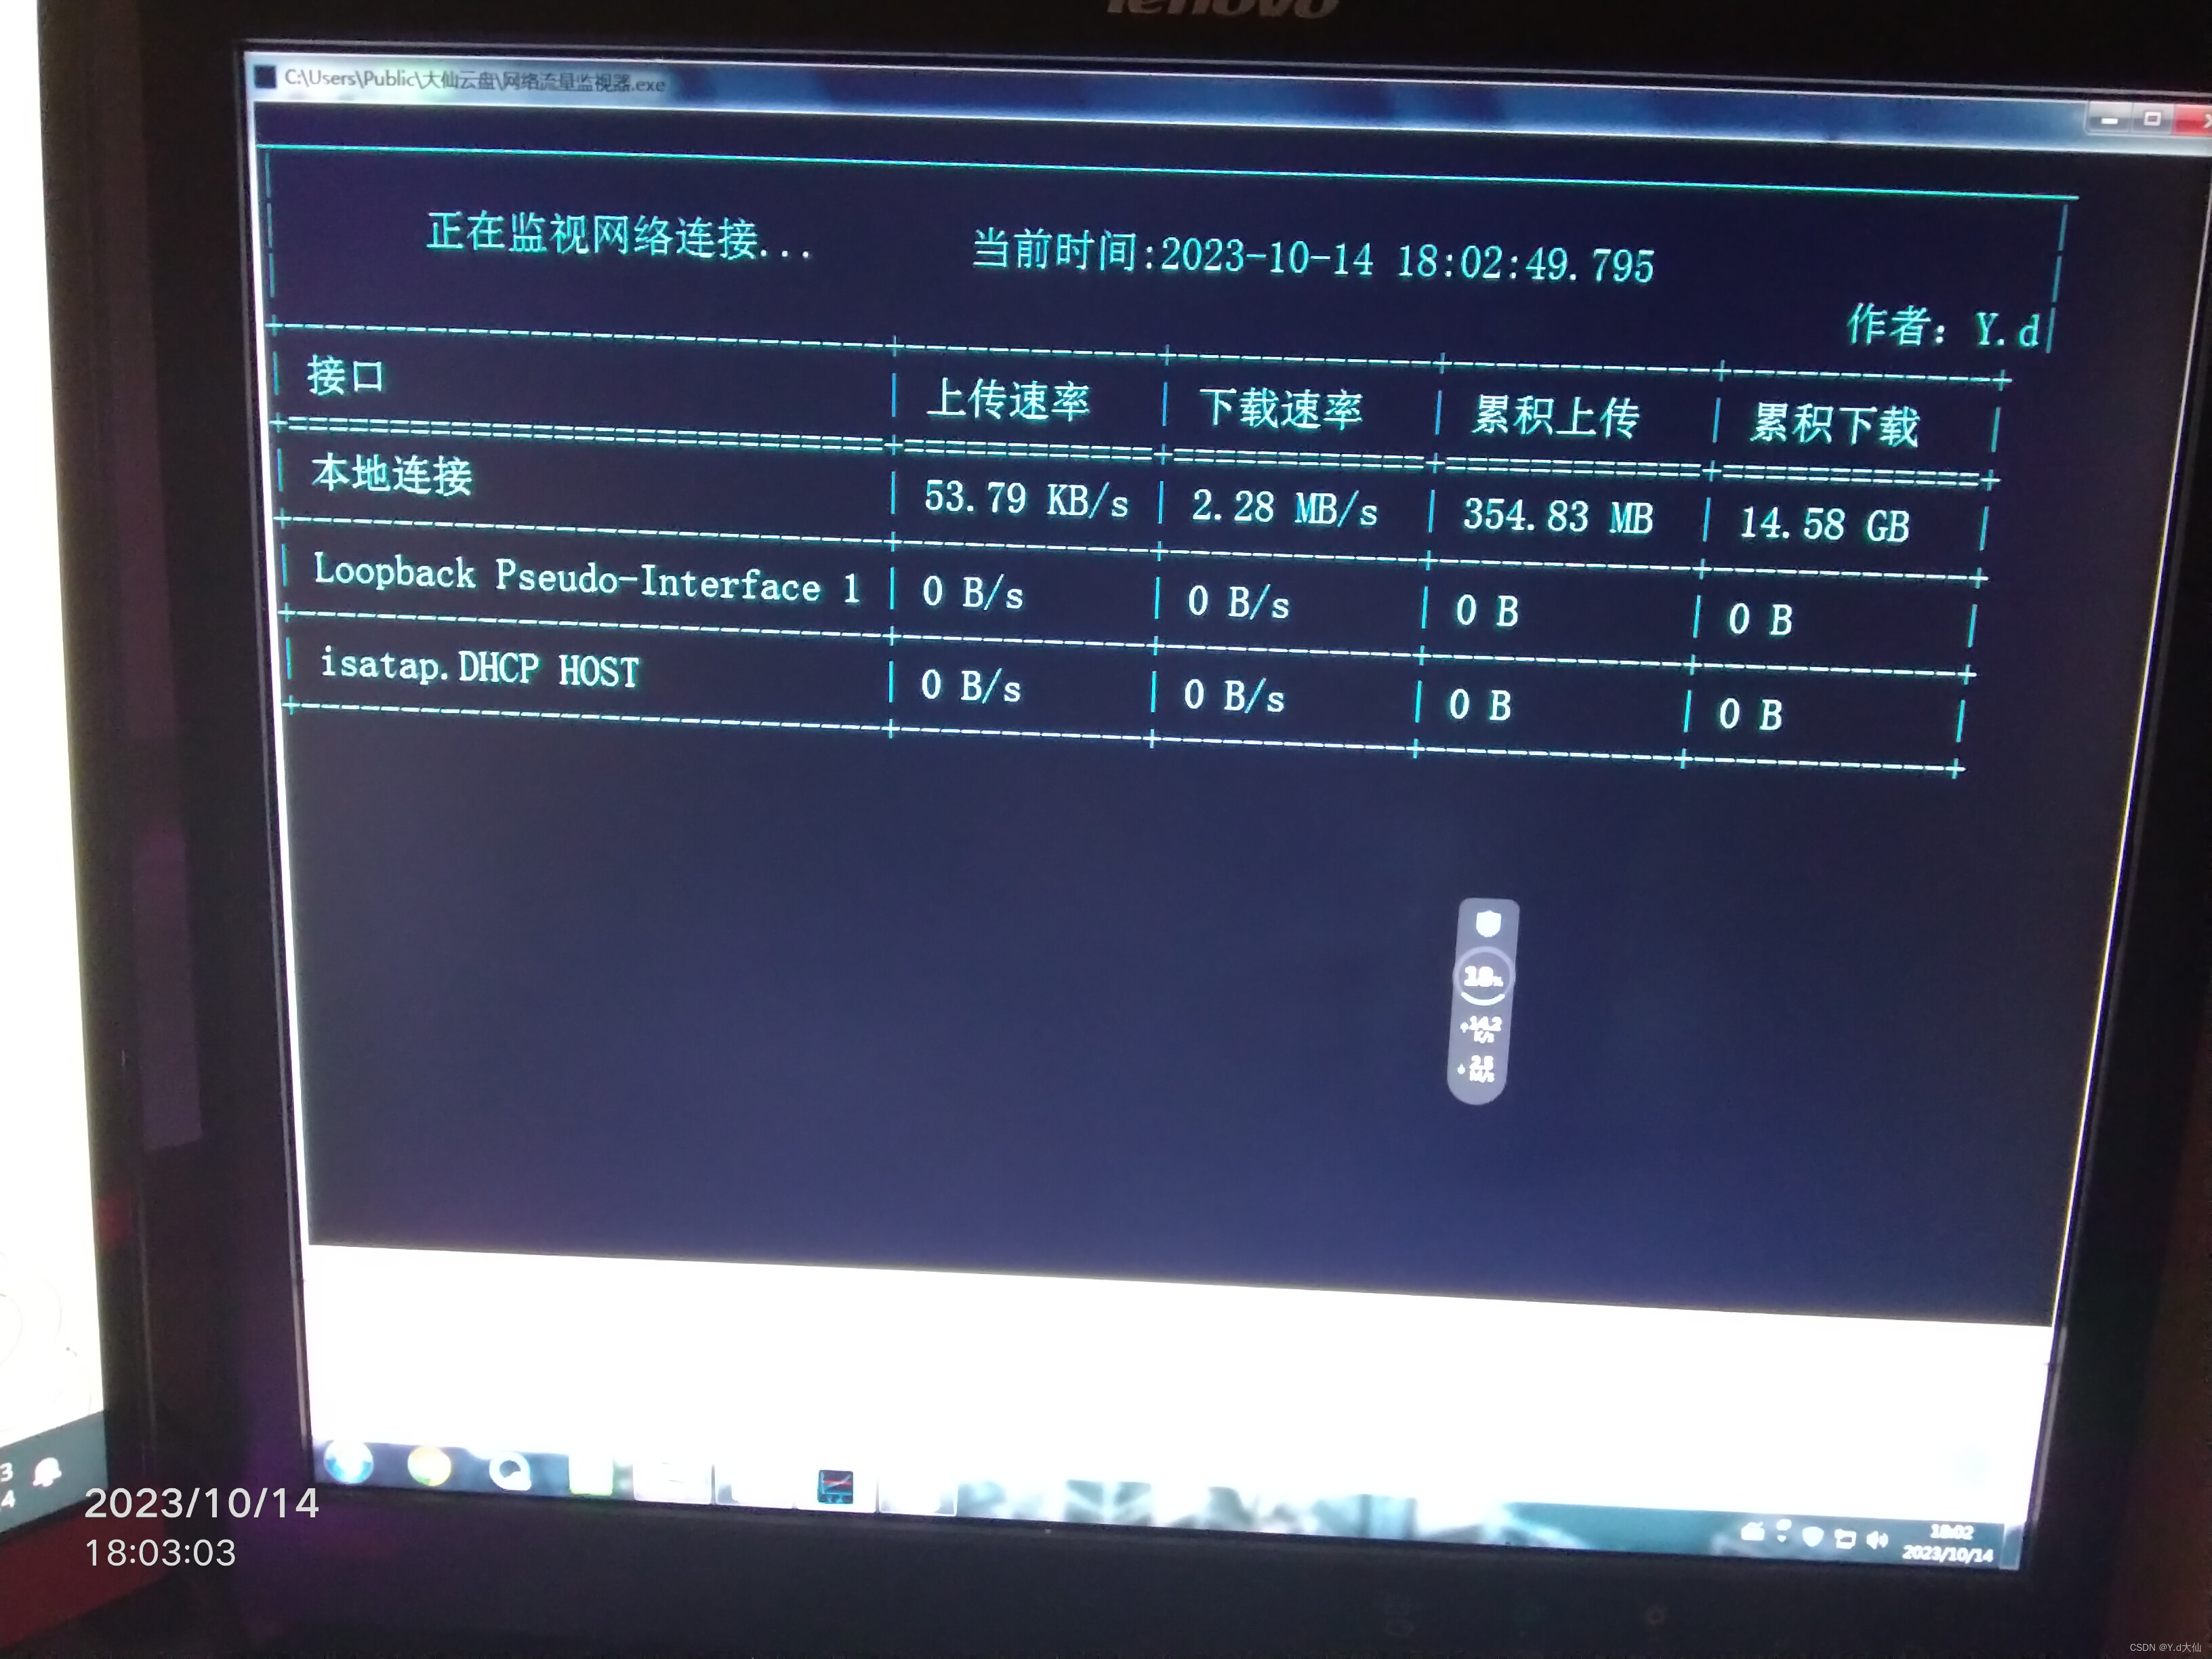
Actual effect: