Our products currently use middleware such as Nginx, Redis, RabbitMQ, MySql, etc. This article introduces how to use Promtheus to monitor these middleware.
There is a picture in “Monitoring Tool: Introduction and Installation of Prometheus” that shows the data trend of Prometheus, as follows:
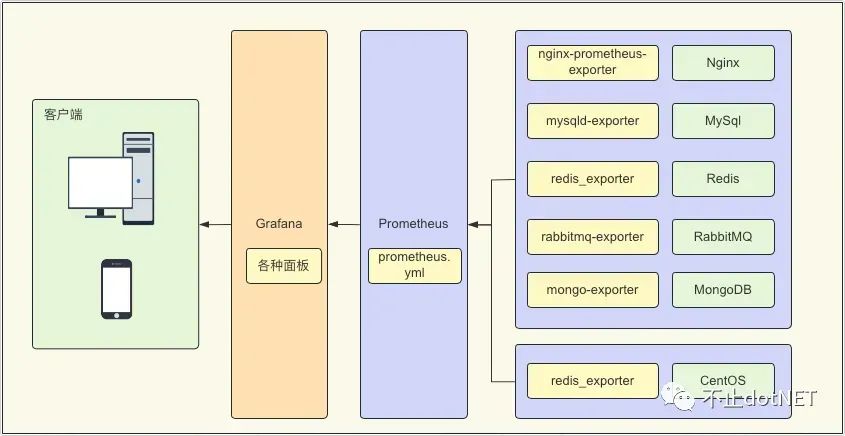
As can be seen from the figure, the first step in monitoring middleware is to install the exporter of the middleware. There are two ways to install it: download the installation file for installation and use Docker for installation. The latter is used in the following example.
Nginx
1. The front-end Web of our product is deployed in the nginx container. The nginx_status module needs to be set in the container’s configuration file to be recognized by the exporter. Add the following code to the nginx configuration file:
location /nginx_status {
        stub_status on;
        access_log off;
        allow all;
       # deny all;
 }
-
For the convenience of testing, it is directly set to allow all. In fact, it can be opened and disabled as needed.
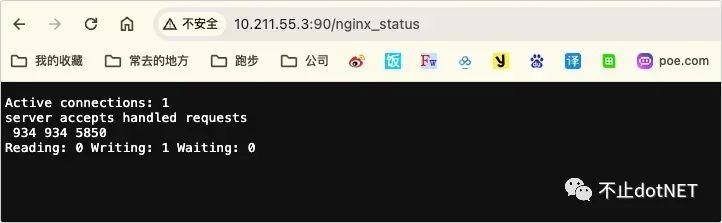
2. After modifying the configuration, restart the Web container and visit http://ip:port/nginx_status. The following interface will appear, indicating that the configuration has taken effect:
3. Execute the following command to install the nginx-exporter container:
docker pull nginx/nginx-prometheus-exporter
docker run -p 9113:9113 -d --restart=always --name nginx-exporter nginx/nginx-prometheus-exporter -nginx.scrape-uri http://10.211.55.3:90/nginx_status
-
http://192.168.3.78/nginx_status is the address of the monitored nginx server.
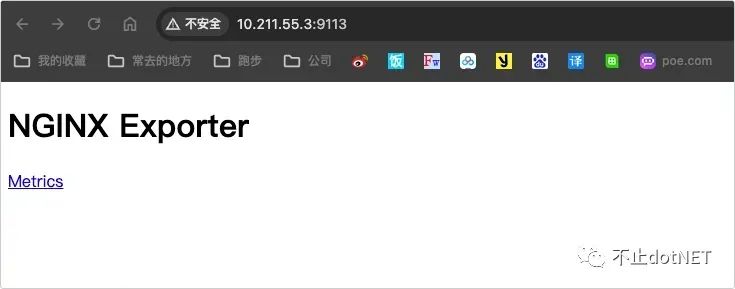
After the container is running, access port 9113, as shown below:
4. Bind in the prometheus configuration file, execute vi /usr/local/prometheus/prometheus.yml, and add job configuration at the bottom of the file:
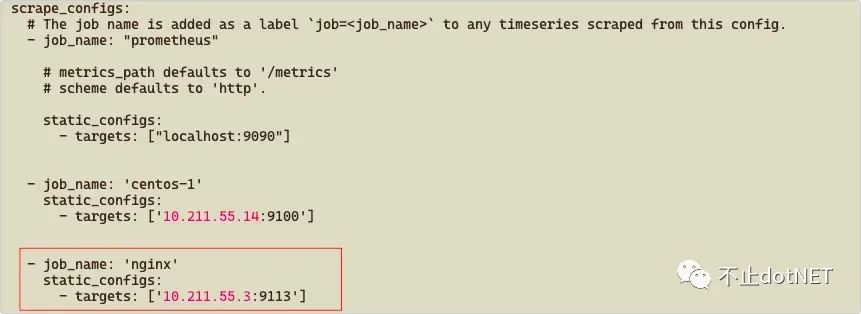
- job_name: 'nginx'
    static_configs:
      - targets: ['10.211.55.3:9113']
5. Execute the command systemctl restart prometheus and the restart will take effect. You can visit http://10.211.55.3:9090/targets to check the status. If it is UP, it means the job setting is successful:

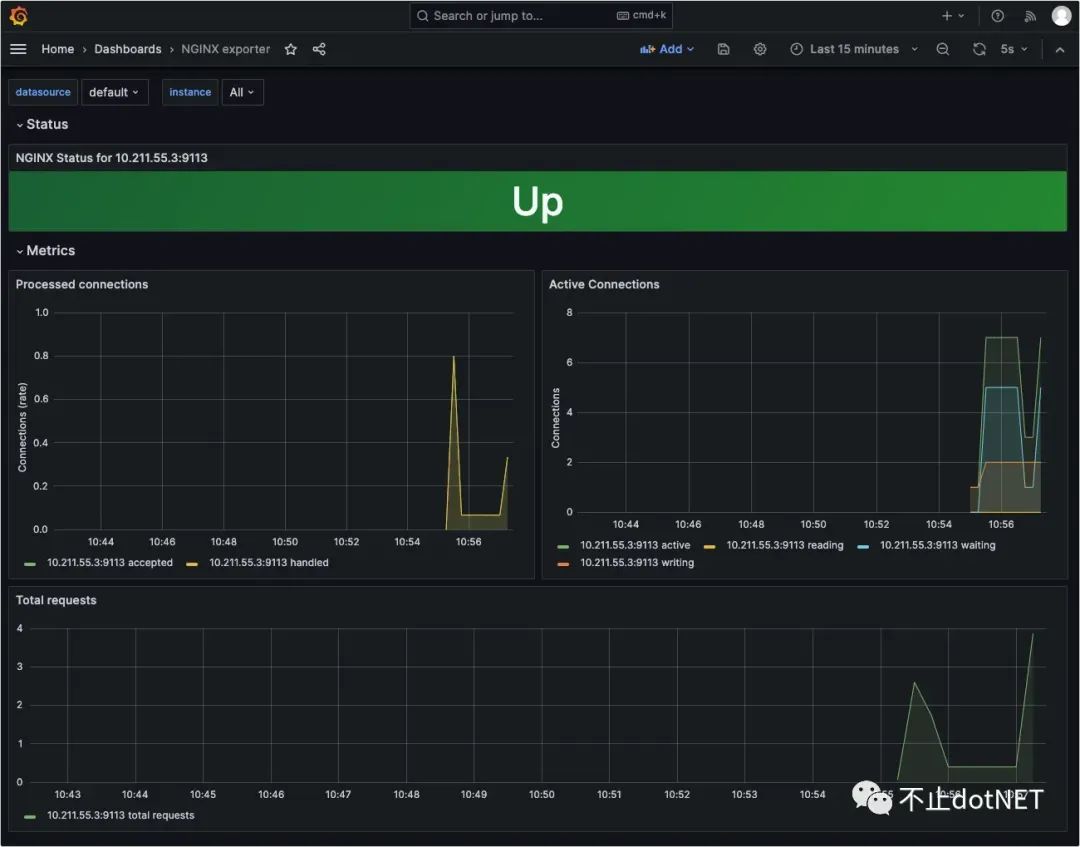
6. Import the 12078 template into Grafana:

7. The final display effect is as follows:
Redis
1. First you need to install redis_exporter and execute the following command to download and install the image:
docker pull oliver006/redis_exporter
# If redis does not have a password, execute the following command
docker run -d --name redis_exporter -p 9121:9121 --network s2v9_test_s2_net oliver006/redis_exporter --redis.addr redis://172.66.9.9:6379
# If redis has a password, execute the following command
docker run -d --name redis_exporter -p 9121:9121 --network s2v9_test_s2_net oliver006/redis_exporter --redis.addr redis://172.66.9.9:6379 --redis.password '000000'
-
In the above command, –network s2v9_test_s2_net is the network where the redis container is located. Because my exporter container and redis container are on the same server, after setting them to the same network, –redis.addr can use the internal IP and port of the container.
-
If deployed separately, there is no need to set –network , just use the server IP and port.
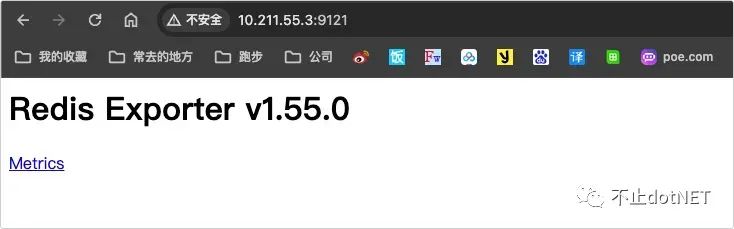
2. After the container runs successfully, the browser access interface is as follows:
3. Bind in the prometheus configuration file, execute vi /usr/local/prometheus/prometheus.yml, and add job configuration at the bottom of the file:
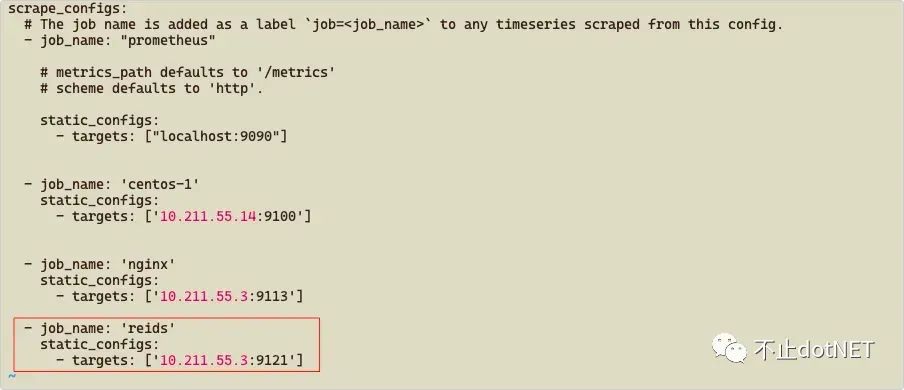
- job_name: 'reids'
    static_configs:
      - targets: ['10.211.55.3:9121']
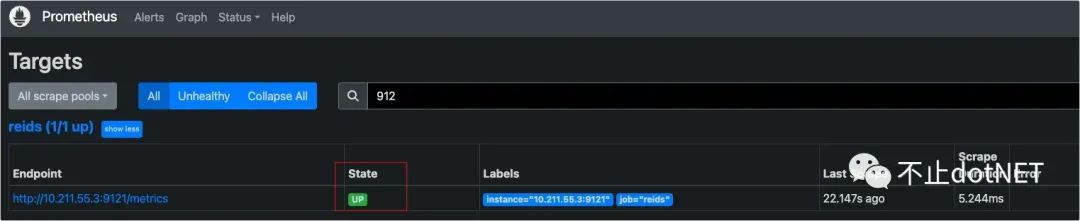
4. Execute the command systemctl restart prometheus and the restart will take effect. You can visit http://10.211.55.3:9090/targets to check the status. If it is UP, it means the job setting is successful:
5. Import the template numbered 763 into Grafana:

6. The final display effect is as follows:

RabbitMQ
1. First you need to install redis_exporter and execute the following command to download and install the image:
docker pull kbudde/rabbitmq-exporter:latest

docker run -d -p 9419:9419 --name rabbitmq-exporter --network s2v9_test_s2_net -e RABBIT_URL=http://172.66.9.8:15672 -e RABBIT_USER=Ican -e RABBIT_PASSWORD=000000 kbudde/rabbitmq-exporter</pre >
 <ul><li><p>-e RABBIT_URL=http://172.66.9.8:15672, what is set here is the internal IP of the RabbitMQ container, so it must be set in the same network, otherwise 15672 needs to be mapped out.</p></li><li><p>-e RABBIT_USER, -e RABBIT_PASSWORD are the username and password of RabbitMQ. The default is guest, but you can also set it yourself.</p></li></ul>
 <p>2. After the container runs successfully, the browser access interface is as follows:</p>
 <img src="//i2.wp.com/img-blog.csdnimg.cn/img_convert/3aaa8ec83198c3dd86ac8d93f48f0c50.jpeg" alt="3aaa8ec83198c3dd86ac8d93f48f0c50.jpeg">
 <p>3. Bind in the prometheus configuration file, execute <code>vi /usr/local/prometheus/prometheus.yml</code>, and add job configuration at the bottom of the file:</p>
 <img src="//i2.wp.com/img-blog.csdnimg.cn/img_convert/2a570fecdbb8a5a10738d20e0546df9d.jpeg" alt="2a570fecdbb8a5a10738d20e0546df9d.jpeg">
 <pre>- job_name: 'rabbitmq'
    static_configs:
      - targets: ['10.211.55.3:9419']
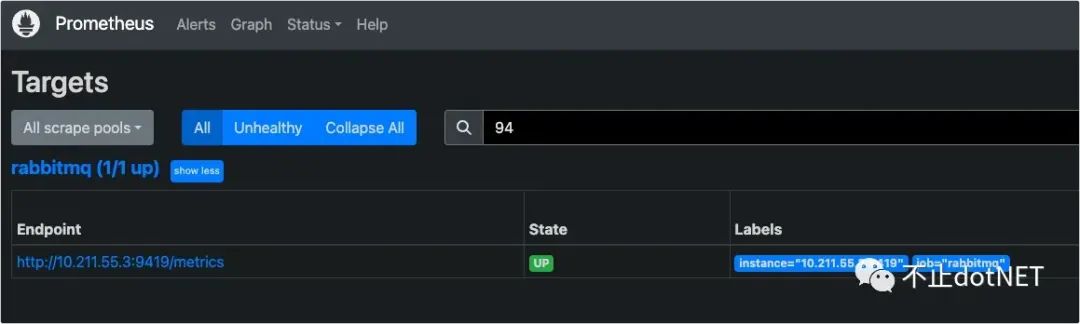
4. Execute the command systemctl restart prometheus and the restart will take effect. You can visit http://10.211.55.3:9090/targets to check the status. If it is UP, it means the job setting is successful:
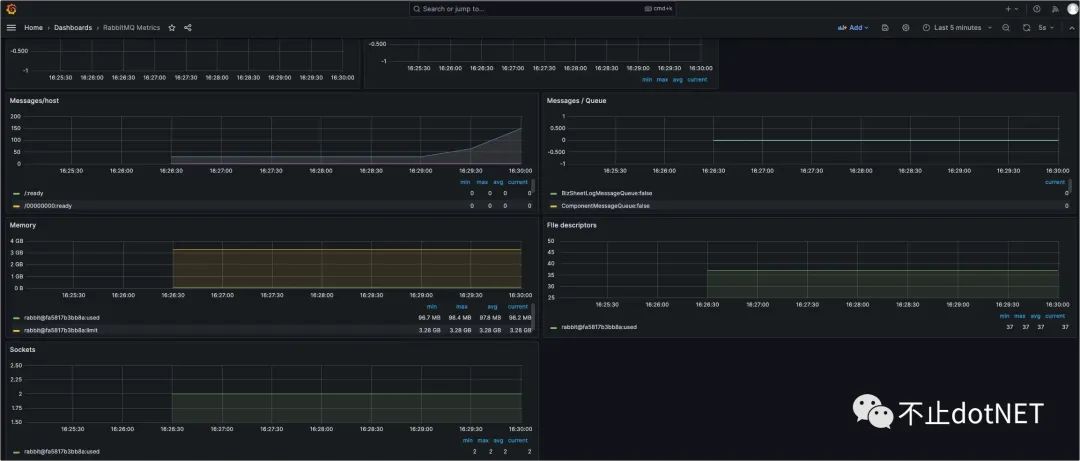
5. Import the template numbered 2121 into Grafana:

6. The final display effect is as follows:
MySql
1. Create an exporter account in the mysql database and set permissions:
CREATE USER 'exporter'@'%' IDENTIFIED BY 'Aa123456';
GRANT PROCESS, REPLICATION CLIENT ON *.* TO 'exporter'@'%';
GRANT SELECT ON performance_schema.* TO 'exporter'@'%';
2. Create a .my.cnf file in the directory /root/exporter/config/mysql. The file content is as follows:
[client]
host=172.66.9.2
port=3306
user=exporter
password=Aa123456
-
host is configured as the container IP of the mysql database
-
user and password are configured as newly created account and password
3. Execute the following command to install mysqld-exporter:
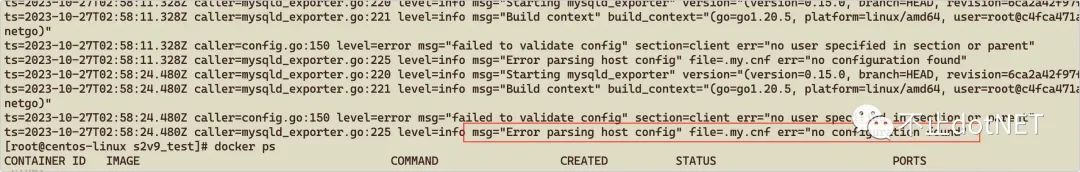
docker pull prom/mysqld-exporter
docker run -d -p 9104:9104 --network s2v9_test_s2_net --restart="always" -v /root/exporter/config/mysql/.my.cnf:/.my.cnf prom/mysqld-exporter
If there is no mapping of the .my.cnf file, the following error will occur:
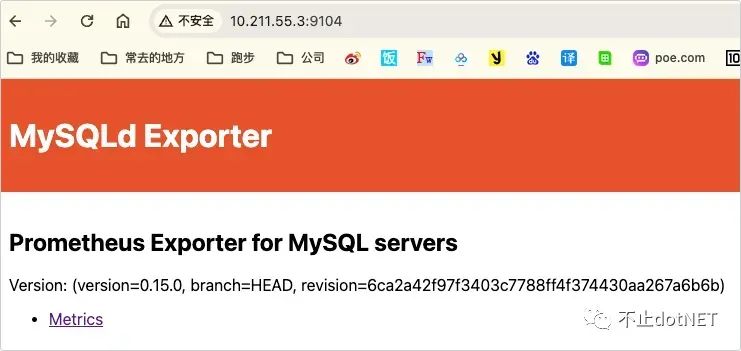
4. After the container runs successfully, the browser access interface is as follows:
5. Bind in the prometheus configuration file, execute vi /usr/local/prometheus/prometheus.yml, and add job configuration at the bottom of the file:
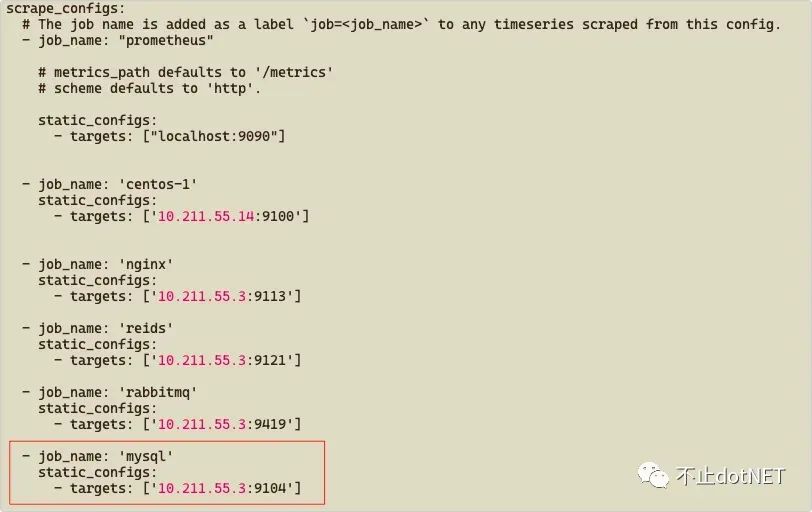
- job_name: 'mysql'
    static_configs:
      - targets: ['10.211.55.3:9104']
6. Execute the command systemctl restart prometheus and the restart will take effect. You can visit http://10.211.55.3:9090/targets to check the status. If it is UP, it means the job setting is successful:

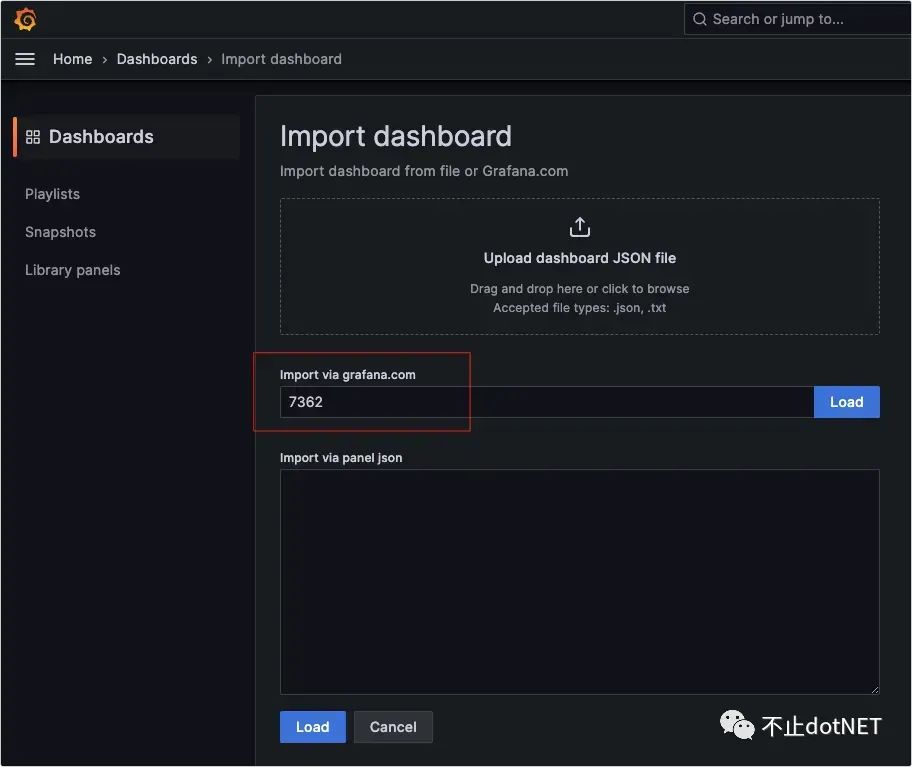
7. Import the template numbered 7362 into Grafana:
8. The final display effect is as follows:
