Use the Linux dstat command to monitor system performance and resources
In Linux systems, understanding the system’s performance and resource usage is critical for effective management and troubleshooting. dstat is a feature-rich command line tool that provides real-time monitoring and statistics of system performance and resources. This article will introduce how to use the dstat command to monitor key indicators and display real-time statistics and charts.
1. Install dstat
In most Linux distributions, dstat is already included in the software repository and can be installed using a package manager. For example, on CentOS systems, dstat can be installed using the following command:
yum install dstat
- 1.
Once the installation is complete, you can start using the dstat command.
2. Basic usage
The dstat command is very flexible and can monitor various system indicators, including CPU usage, memory usage, disk I/O, network traffic, etc. The following is the basic usage of the dstat command:
dstat [options] [interval] [count]
- 1.
options: used to specify the indicators to be monitored. Multiple options can be specified at the same time.
interval: Specifies the time interval (in seconds) for sampling data. The default value is 1 second.
count: Specifies the number of times to sample data. If not specified, dstat will continue monitoring until manually interrupted.
Here are some commonly used dstat options:
-c: Monitor CPU usage.
-m: Monitor memory usage.
-d: Monitor disk I/O.
-n: Monitor network traffic.
-p: Monitor process and system call statistics.
-s: Monitor the system running status.
3. Example usage
(1). Monitor CPU usage and system load
To monitor CPU usage and system load, you can run the following commands:
dstat -c -l
- 1.

This will show real-time CPU usage and system load.
(2). Monitor memory usage
To monitor memory usage, you can run the following command:
dstat -m
- 1.
Usage: dstat [-afv] [options..] [delay [count]]
Versatile tool for generating system resource statisticsDstat options:
-c, –cpu enable cpu stats
-C 0,3,total include cpu0, cpu3 and total
-d, –disk enable disk stats
-D total,hda include hda and total
-g, –page enable page stats
-i, –int enable interrupt stats
-I 5,eth2 include int5 and interrupt used by eth2
-l, –load enable load stats
-m, –mem enable memory stats
-n, –net enable network stats
-N eth1,total include eth1 and total
-p, –proc enable process stats
-r, –io enable io stats (I/O requests completed)
-s, –swap enable swap stats
-S swap1,total include swap1 and total
-t, –time enable time/date output
-T, –epoch enable time counter (seconds since epoch)
-y, –sys enable system stats–aio enable aio stats
–fs, –filesystem enable fs stats
–ipc enable ipc stats
–lock enable lock stats
–raw enable raw stats
–socket enable socket stats
–tcp enable tcp stats
–udp enable udp stats
–unix enable unix stats
–vm enable vm stats
–vm-adv enable advanced vm stats
–zones enable zoneinfo stats–list list all available plugins
–plugin enable external plugin by name (see –list)-a, –all equals -cdngy (default)
-f, –full automatically expand -C, -D, -I, -N and -S lists
-v, –vmstat equals -pmgdsc -D total–bits force bits for values expressed in bytes
–float force float values on screen
–integer force integer values on screen–bw, –black-on-white change colors for white background terminal
–color force colors
–nocolor disable colors
–noheaders disable repetitive headers
–noupdate disable intermediate updates
–output file write CSV output to file
–profile show profiling statistics when exiting dstatdelay is the delay in seconds between each update (default: 1)
count is the number of updates to display before exiting (default: unlimited)

This will show real-time memory usage, including used memory, cache, swap space, etc.
(3). Monitor disk I/O
To monitor disk I/O, you can run the following command:
dstat -d
- 1.

This will display real-time disk read and write rates, IOPS and other information.
(4). Monitor network traffic
To monitor network traffic, you can run the following command:
dstat -n
- 1.
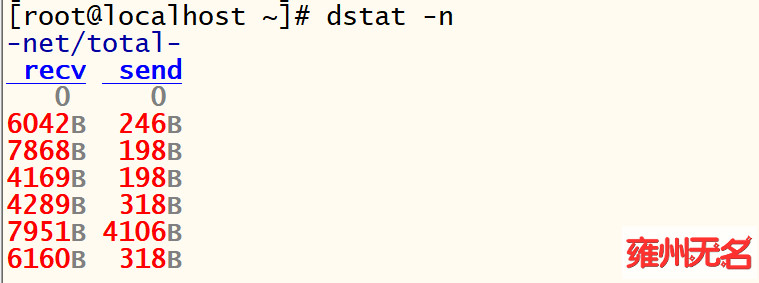
This will show real-time network traffic conditions, including the amount of data being received and sent.
(5). Monitor process and system call statistics
To monitor process and system call statistics, you can run the following command:
dstat -p
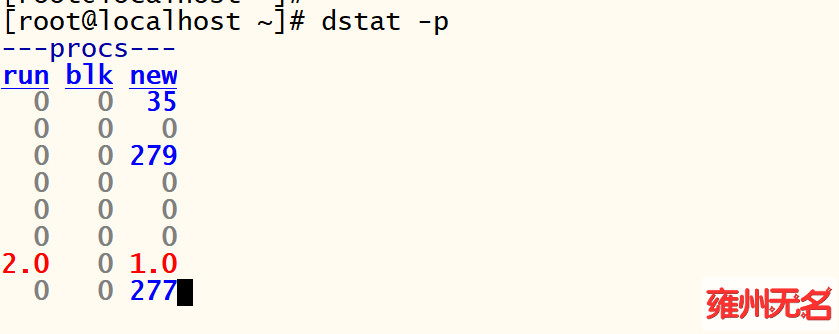
This will display real-time process and system call statistics, including the process’s CPU usage, memory usage, disk I/O, etc.
(6).Monitoring system swap
To monitor system swap, you can run the following command:
dstat -s
This will display real-time system operating status information, including online time, number of task switches, number of interruptions, etc.
Conclusion:
dstat is a very useful Linux command line tool that can help you monitor and count system performance and resource usage in real time. By using the dstat command, you can easily monitor key indicators such as CPU, memory, disk, and network, and display them in the form of real-time statistics and charts. Mastering the use of the dstat command will provide you with strong support in managing and maintaining your Linux system.