Foreword
- There are currently many digital human implementation technologies. I use ER-NeRF here. You can see its introduction here: ICCV 2023 | ER-NeRF: Efficient area-aware neural radiation field for synthesizing high-fidelity Talking Portrait-https://zhuanlan .zhihu.com/p/644520609
- ER-NeRF project address: https://github.com/Fictionarry/ER-NeRF
- ER-NeRF, RAD-NeRF, they all inherit from AD-NeRF and have a GUI interface based on dearpygui
- But unfortunately, this GUI is difficult to run, and there are generally no large GPU machines locally. We need a webui that can run on the cloud GPU server.
- ER-NeRF training is very simple and requires very few materials. The training steps do not require a GUI.
- When reasoning, a reasoning interface is needed to facilitate general users. At the same time, the UI interface can be used to perform reasoning while playing videos, optimizing the user experience.
- Based on this, after a round of research, we plan to use Gradio to build webui and transform the inference code. The frame images generated by inference are directly stored as ts format videos. The web front-end uses the hls protocol to load m3u8 files and stream the inference results.
Final effect
- Run chart

- inference diagram

Implementation steps
Gradio
Very common operation, a left and right column layout:
with gr.Blocks() as page:
    with gr.Row():
        with gr.Column():
            model = gr.Dropdown(
                choices=models, value=models[0], label="select model", elem_id="modelSelectDom"
            )
            audType = gr.Dropdown(
                choices=['deepspeech', 'hubert', 'esperanto'], value='deepspeech', label="Model audio processing method"
            )
            with gr.Tab('recording'):
                audio1 = gr.Audio(source="microphone", label='If you cannot record normally, please upload the audio file directly!')
            with gr.Tab('Upload recording'):
                audio2 = gr.File(label='Upload recording file', file_types=['audio'])
            btn = gr.Button("submit", variant="primary", elem_id="submitBtn")
        with gr.Column():
            msg = gr.Label(label='Running Status', elem_id="logShowDiv", value='')
            gr.Label(label='Inference Video', elem_id="resultVideoDiv", value='')

    btn.click(
        action,
        inputs=[
            model, audType, audio1, audio2
        ],
        outputs=[msg],
    )
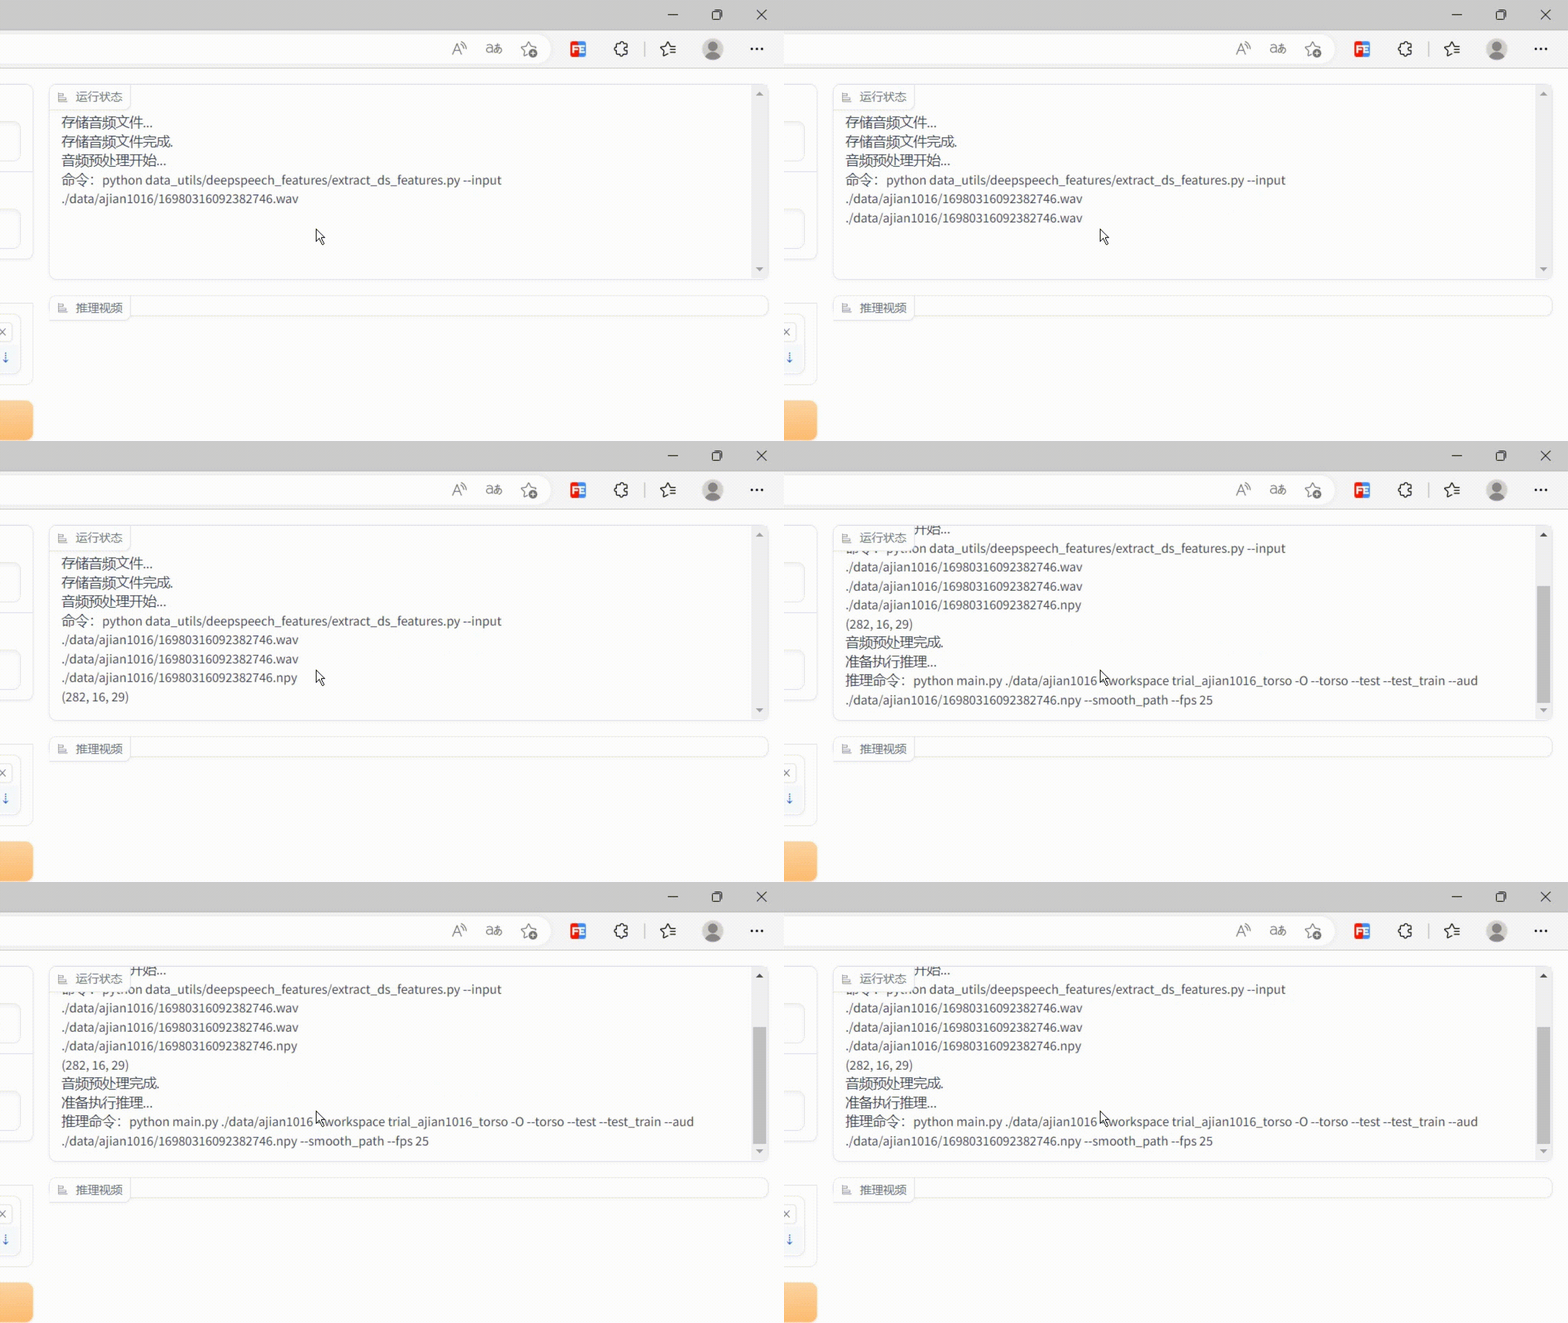
As you can see, the output is configured with a msg label component, which is used to display the log information of the current running of the server.
So the first question in this project is: How to display the server running log in real time?
Look at the code:
def log_out(new_log):
    print(new_log)
    return new_log

def action(model, audType, audio1, audio2):
    # Store audio files
    yield log_out('Storing audio files...')
    wavFilePath = os.path.join(modelBasePath, model, str(time.time()).replace('.', '') + '.wav')
    if audio1:
        rate, data = audio1
        write(wavFilePath, rate, data.astype(np.int32))
    elif audio2:
        suffix = audio2.name.split('.')[-1]
        shutil.copy2(audio2.name, wavFilePath.replace('.wav', '.' + suffix))
    if not os.path.exists(wavFilePath):
        yield log_out('Failed to store audio file!')
    else:
        yield log_out('Storing audio file completed.')

    #Perform audio preprocessing
    yield log_out('Audio preprocessing starts...')
    if audType == 'deepspeech':
        cmd = f'python data_utils/deepspeech_features/extract_ds_features.py --input {wavFilePath}'
    elif audType == 'hubert':
        cmd = f'python data_utils/hubert.py --wav {wavFilePath}'
    else:
        cmd = f'python data_utils/wav2vec.py --wav {wavFilePath} --save_feats'
    yield log_out(f'Command: {cmd}')
    process = subprocess.Popen(cmd, shell=True, stdout=subprocess.PIPE, stderr=subprocess.PIPE)
    while True:
        output = process.stdout.readline()
        if output == b'' and process.poll() is not None:
            break
        if output:
            yield log_out(output.strip().decode('utf-8'))
            time.sleep(0.5)
    process.wait()
    yield log_out(f'Audio preprocessing completed.')

    # Confirm whether the audio preprocessing is completed
    npyPath = '.'.join(wavFilePath.split('.')[:-1]) + '.npy'
    stop=False
    if not os.path.exists(npyPath):
        yield log_out(f'The audio preprocessed npy file was not found, the program will exit!')
        stop=True
    if stop:
        return

    # Build inference commands
    yield log_out(f'Ready to perform inference...')
    cmd = f'python main.py {os.path.join(modelBasePath, model)} --workspace trial_{model}_torso -O --torso --test --test_train --aud {npyPath} --smooth_path - -fps 25'
    yield log_out(f'Inference command: {cmd}')
    process = subprocess.Popen(cmd, shell=True, stdout=subprocess.PIPE, stderr=subprocess.PIPE)
    while True:
        output = process.stdout.readline()
        if output == b'' and process.poll() is not None:
            break
        if output:
            yield log_out(output.strip().decode('utf-8'))
            time.sleep(0.5)
    process.wait()
As you can see, using the yield keyword directly allows the server’s output to respond multiple times.
However, the final interface effect of this operation is that the log changes with each yield, and the historical accumulated log information is directly overwritten.
In order to allow the output to accumulate historical log information and display it together, we need to record the log. This is also very simple, just add a history_log:
history_log=''
def log_out(new_log):
global history_log
history_log + = new_log + '<br>'
   print(new_log)
   return history_log
   .......
Now we can see that the logs are indeed output cumulatively, but the display effect is not good enough. Moreover, every time a log is output, the page component will be redrawn. Too many logs will also affect the server memory.
Is there any way to create a similar effect to the shell command window? When the log is output, the scroll bar is at the bottom and the currently output log is always visible?
After some painstaking exploration, I finally found a solution.
The core idea is: yield continues to output, uses an input element to receive it on the page, then rewrites the setvalue method of the input, extracts the log value of this output in the method, then adds the value to the end of a div, and uses js to make the div The scroll bar remains at the bottom.
Core code:
_script = '''
   async()=>{
      .......
       //Monitor log output and display
               let output = document.querySelector("#logDivText .border-none");
               if(!output){
                   return false;
               }
               let show = document.querySelector('#logShowDiv .container')
               show.style.height='200px'
               show.style.overflowY='scroll'
               show.innerHTML=""
               Object.defineProperty(output, "value", {
                   set: function (log) {
                       if(log & amp; & amp; log!=''){
                           show.innerHTML = show.innerHTML + '<br>' + log
                               show.scrollTop=show.scrollHeight
                           }
                       }
                       return this.textContent = log;
                   }
               });
               ...
   }
'''
#When the page is loaded, load the customized js into it
page.load(_js=_script)
This achieves the effect of monitoring server log output. The effect is as follows:

The code has been put on gitee. If you have any questions, you can send a private message.
The next article explains how to write the sequence diagram in the memory into a ts file of the hls protocol through the pipeline and save it.

